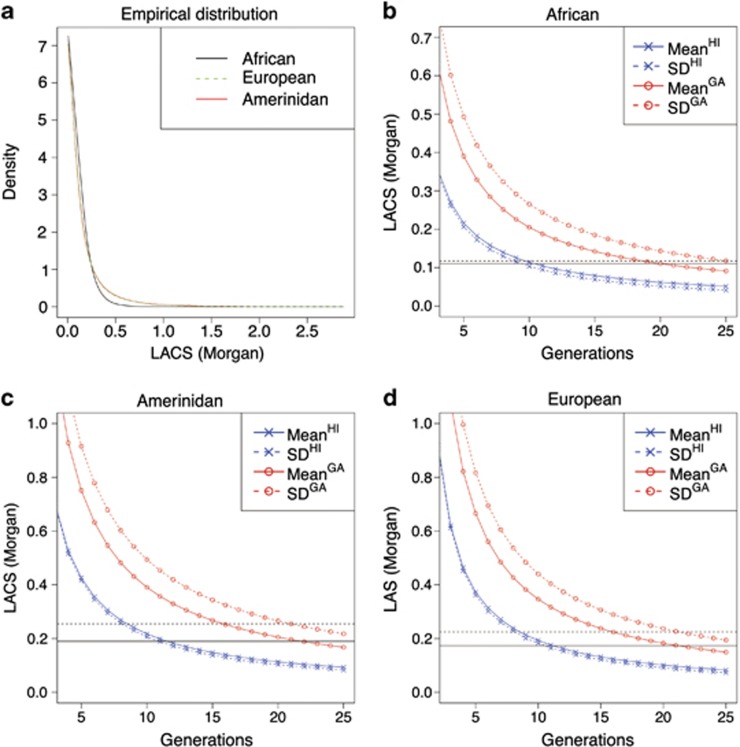
Figure 5.
Admixture history of Mexicans based on three-way admixture. (a) Distribution of LACS for African, European and Amerindian ancestral components in Mexican. (b) Mean and SD of LACS for African ancestral component and theoretical distributions in the HI and GA models. (c) Mean and SD of LACS for Amerindian ancestral component and theoretical distributions in the HI and GA models. (d) Mean and SD of LACS for European ancestral component and theoretical distributions in the HI and GA models. Black solid and dashed lines represent the empirical mean and SD of LACS, respectively.

