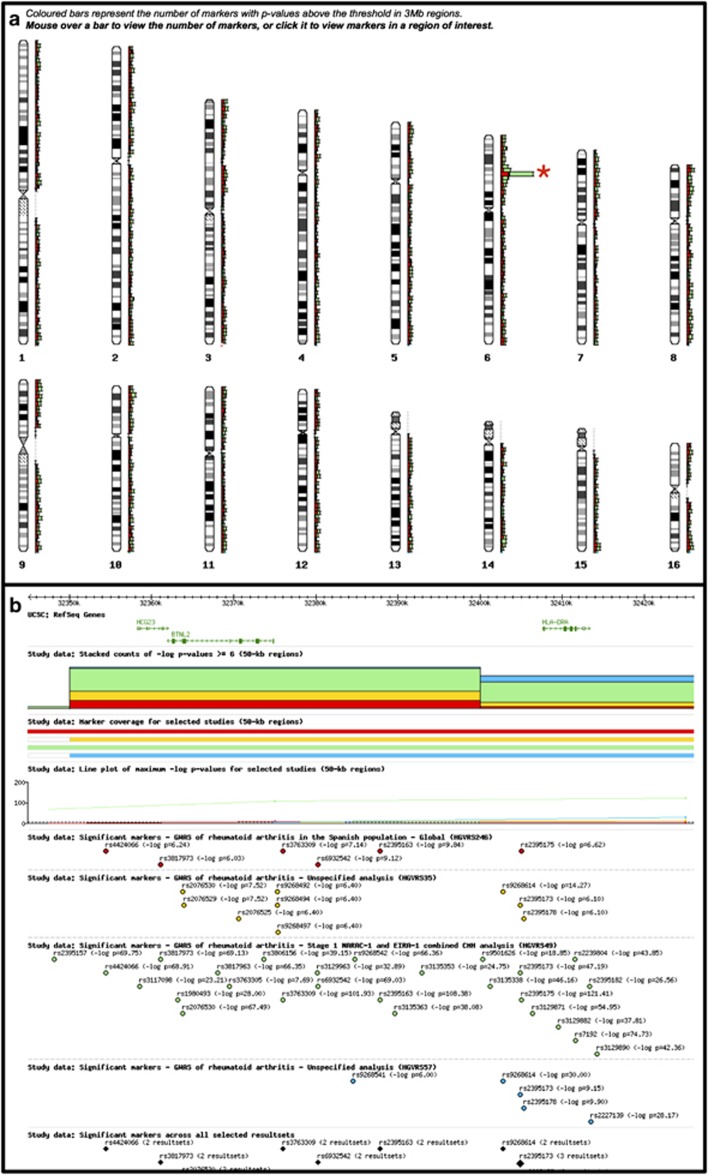
Figure 1.
Data integration example using the GWAS Central graphical browser. (a) The ‘genome view' of four distinct rheumatoid arthritis studies showing regions of association. The coloured bars denote counts of marker P-values below a selected and adjustable threshold. Selecting the peak on chromosome 6 adjacent to the red asterisk zooms in on that section of the genome to give b. (b) The higher resolution ‘region view' of the data provides UCSC RefSeq genes, HapMap SNPs for the various cohorts and Human Genetic Mutation Database rare disease mutations.

