
Figure 5.
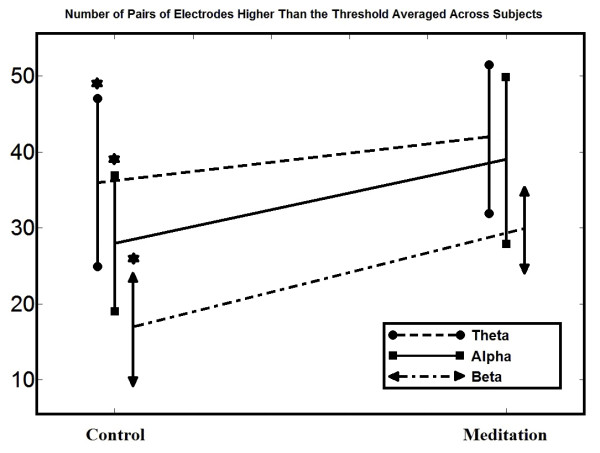
EEG phase analysis. Number of pairs of electrodes with higher PLV than the threshold averaged across subjects (N = 34). Star symbols show which comparisons are statistically significant.
Official websites use .gov
A
.gov website belongs to an official
government organization in the United States.
Secure .gov websites use HTTPS
A lock (
) or https:// means you've safely
connected to the .gov website. Share sensitive
information only on official, secure websites.
EEG phase analysis. Number of pairs of electrodes with higher PLV than the threshold averaged across subjects (N = 34). Star symbols show which comparisons are statistically significant.