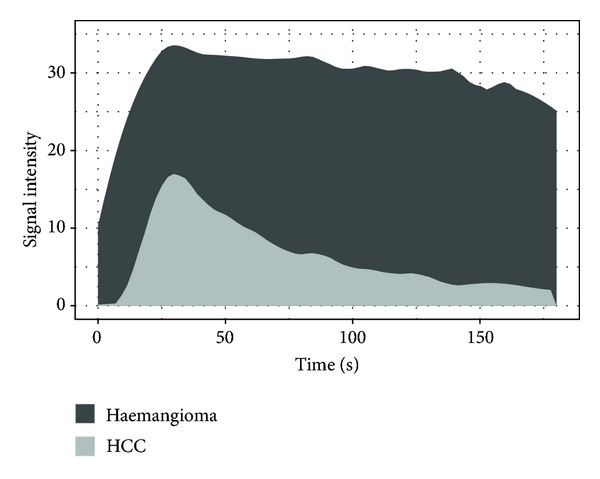
Figure 2.

Time-intensity curve of 5 HCCs and 4 haemangiomas after local polynomial regression fitting using LOESS. RBV and RBF are directly proportional to the area under the curve and, therefore, benefit from a continuous registration to the late phase.
