
Figure 1.
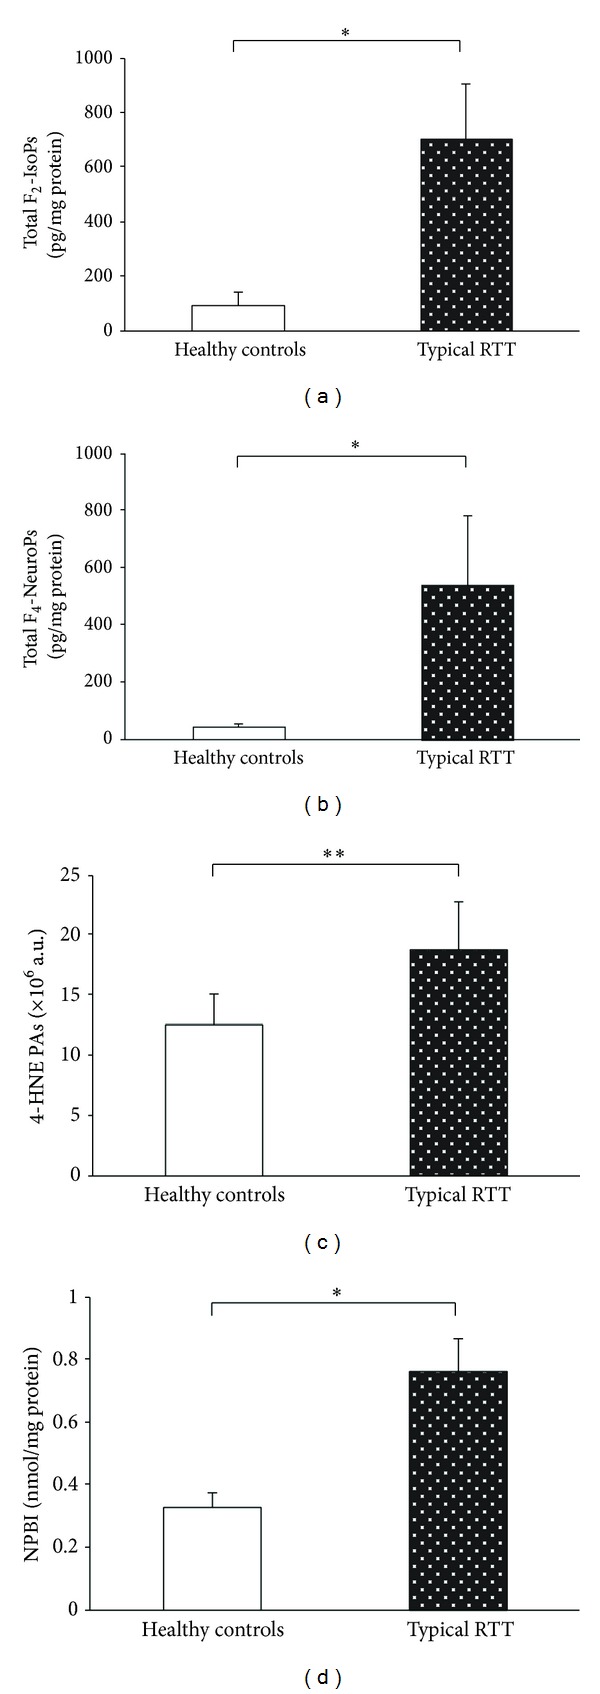
Increased levels of total (i.e., sum of free and esterified form) F2-IsoPs, total F4-NeuroPs, 4-HNE PAs, and NPBI in RTT skin fibroblast as compared to the control cells. *P < 0.0001, **P = 0.0013. Data are expressed as means ± standard deviation. Legend: F2-IsoPs, F2-isoprostanes; F4-NeuroPs, F4-neuroprostanes; 4-HNE PAs, 4-hydroxy-2-nonenal protein adducts; NPBI, nonprotein bound iron.