
Figure 2.
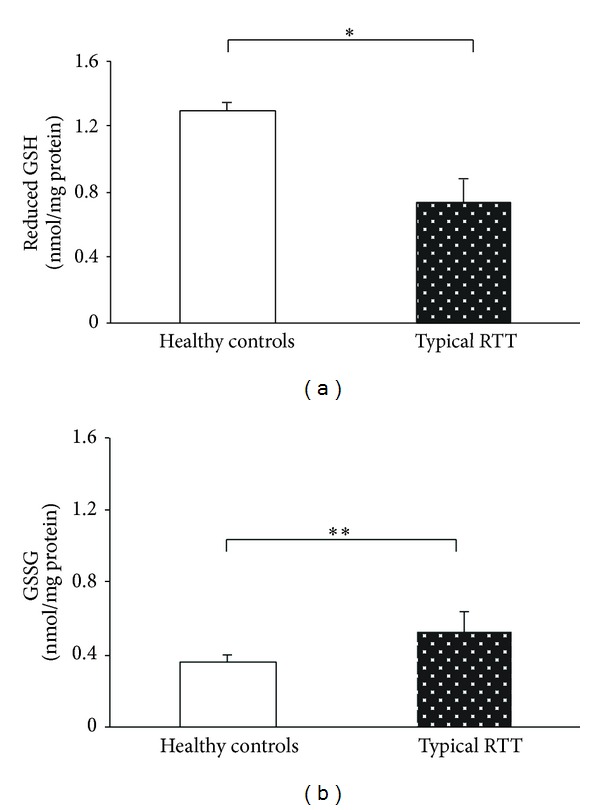
Significant reduction in cellular GSH and significant increase of GSSG in RTT skin fibroblast as compared to control cells. *P < 0.0001, **P = 0.0033. Data are expressed as means ± standard deviation. Legend: GSH reduced glutathione; GSSG, oxidized glutathione.