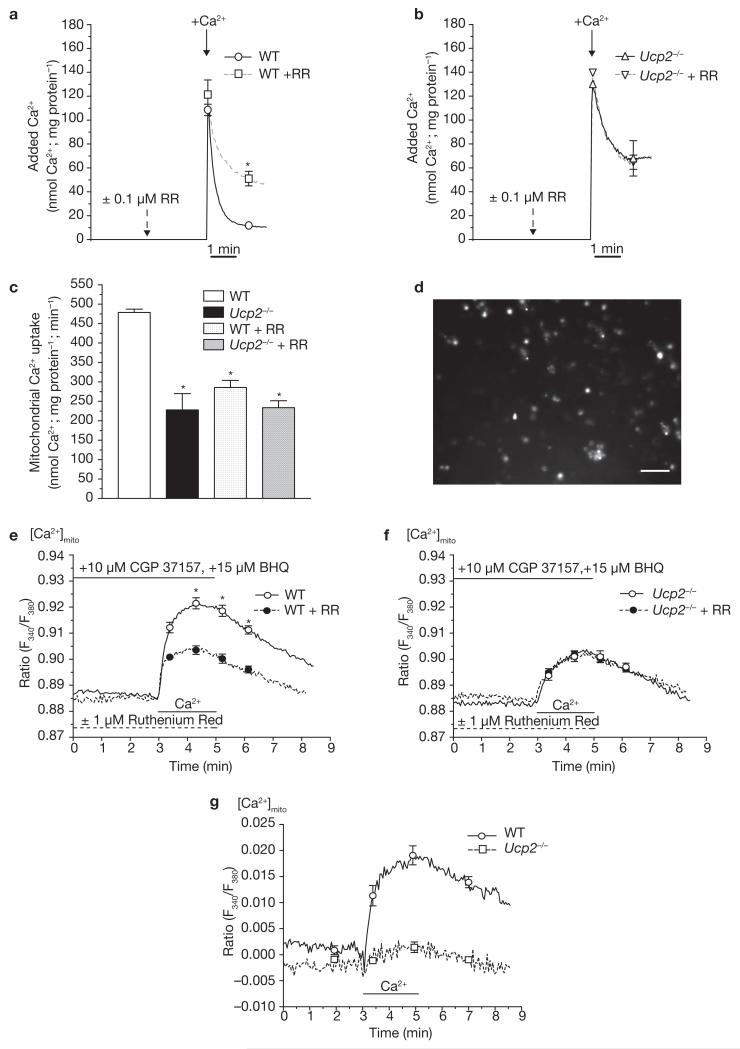
Figure 3. In isolated liver mitochondria from Ucp2−/− mice, no ruthenium red (RR)-sensitive Ca2+ uniporter exists.
(a) Ca2+ uptake of suspended isolated liver mitochondria from wild-type (WT) animals was measured by monitoring the reduction of extra-mitochondrial Ca2+ on application of 140 nmol Ca2+ mg−1 mitochondrial protein with Calcium Green-5N (0.1 μM). Experiments were performed in the absence (n = 7) and presence (WT + RR, n = 4; single asterisk indicates P <0.05 versus WT) of ruthenium red, an established inhibitor of mitochondrial Ca2+ uniporter (100 nM). (b) In suspended liver mitochondria isolated from Ucp2−/− mice, Ca2+ uptake (measured as described in a), was reduced (Ucp2−/−; n = 7). The remaining Ca2+ uptake was insensitive to ruthenium red (100 nM; Ucp2−/− + RR; n = 4). n.s. versus Ucp2−/−. (c) Kinetics of mitochondrial Ca2+ uptake within 30 s after addition of Ca2+ calculated from the data presented in a and b. The asterisk indicates P <0.05 versus WT. (d) Fluorescence image of fura-2 loaded single mitochondria freshly isolated from mouse liver. The scale bar represents 10 μm. (e) In isolated single liver mitochondria from wild-type animals, mitochondrial Ca2+ sequestration was measured in the absence (WT, n = 44) and presence (WT + RR, n = 22) of ruthenium red (1 μM) by mitochondrial fura-2. The asterisk indicates P <0.05 versus WT. (f) Ca2+ uptake in isolated single mitochondria from Ucp2−/− mice measured by mitochondrial fura-2 was reduced (Ucp2−/−, n = 34) compared with that obtained in the wild-type littermates. The remaining Ca2+ uptake into the liver mitochondria of Ucp2−/− mice was not ruthenium red-sensitive (Ucp2−/− + RR, n = 21). n.s. versus Ucp2−/−. (g) Ruthenium red-sensitive mitochondrial Ca2+ uptake in single mitochondria freshly isolated from wild-type and Ucp2−/− (Ucp2−/−, asterisk indicates P <0.05 versus WT) mice calculated from data in e and f. The error bars represent s.e.m (a–f) or indicate 95% confidencence intervals at the times shown (g).

