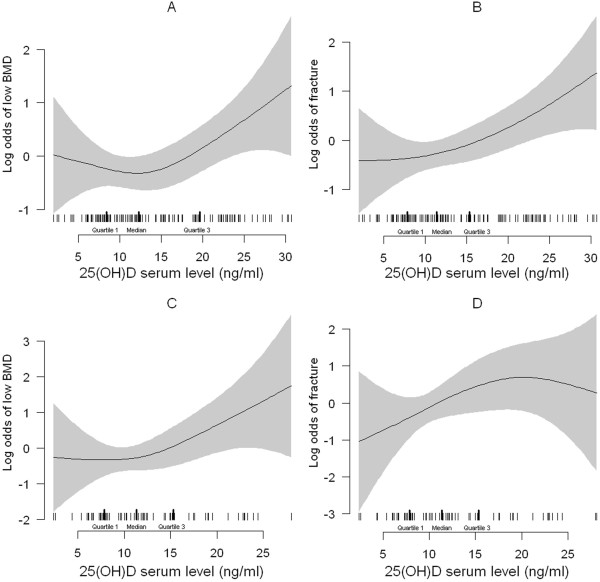
Figure 3.

Relation between 25(OH)D and low BMD and fracture. Relation between 25(OH)D (ng/ml) and the odds of low BMD (A, C) and fracture (B, D) with the use of a generalized additive model (GAM) for the totality of patients (A, B) and after exclusion of Vitamin D or BP-treated patients (C, D) respectively. The relationship between vitamin D levels and the odds of low BMD follows a U-shaped curve (A, C) while the relationship with fracture risk follows a linear relationship. Shaded areas represent the 95% confidence intervals and the tick marks show the distribution (with median and interquartile range) of 25(OH)D values. BMD, bone mineral density; BP, bisphosphonates.
