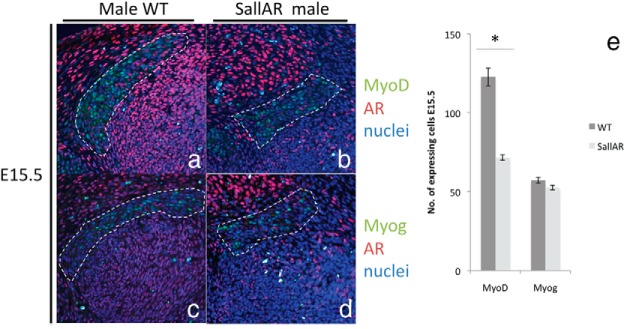
Figure 6.

Immunostaining (A–D) and quantitative assessment (E) of the MyoD- and Myog-expressing region, costained with anti-AR, between male WT and SallAR mutants at E15.5 are shown. The BC is inside the traced region. Three embryonic specimens from different litters were analyzed by counting cells in the whole BC region (three to four sections per sample). *, P < .05. Error bars, means ± SE.
