
Figure 2.
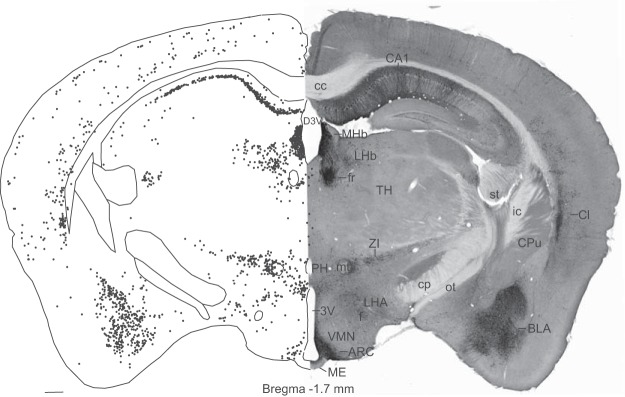
Photomicrograph (right) and computer-assisted map (left) of EGFP immunocytochemistry in a representative brain section from a Tac2-EFGP female mouse. Sections were visualized with nickel-intensified DAB. Each black dot on the left represents a single immunoreactive soma mapped with the Neurolucida image-combining computer microscope. See Supplemental Figures 1 and 2 for additional maps at multiple levels of the hypothalamus. 3V, third ventricle; ARC, arcuate nucleus; BLA, basolateral amygdaloid nucleus; CA1, field CA1 hippocampus; cc, corpus callosum; Cl, claustrum; cp, cerebral peduncle; CPu, caudate putamen (striatum); f, fornix; fr, fasciculus retroflexus; ic, internal capsule; LHA, lateral hypothalamic area; LHb, lateral habenular nucleus; ME, median eminence; MHb, med habenular nucleus; mt, mammilothalamic tract; ot, optic tract; PH, posterior hypothalamus; st, stria terminalis; TH, thalamus; VMN, ventromedial nucleus; ZI, zona incerta. Scale bar, 250 μm.