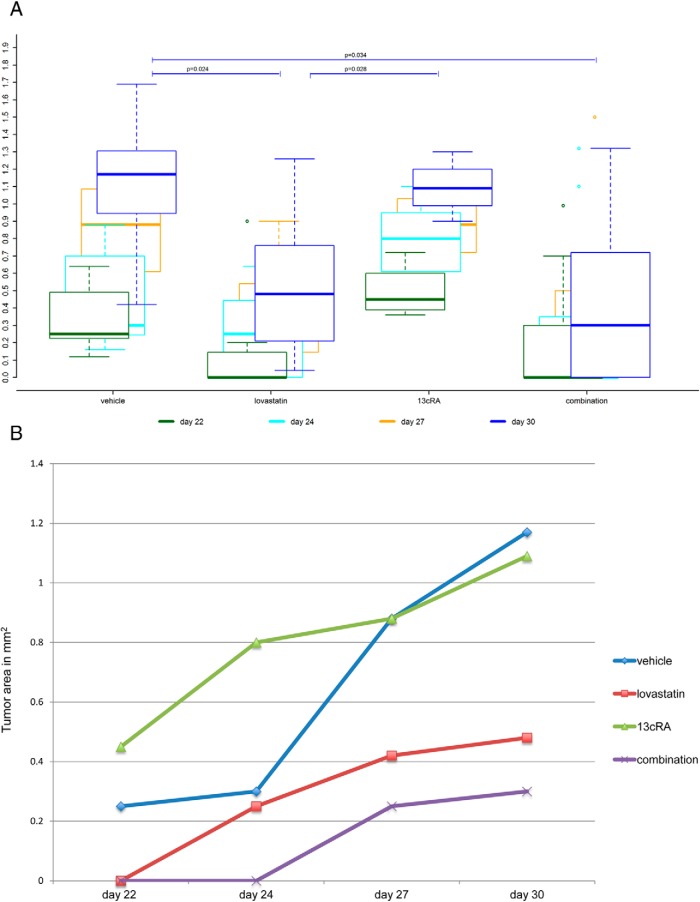
Figure 2.
Tumor areas. A, Tumor areas in mm2 (tumor area: l*w) at 4 different time points from day 22 to 30 after tumor cell injection. Boxplots are denoting median (thick line), quartiles (upper and lower margin of the box), maximum and minimum (whiskers), and outliers that are more than the 1.5-fold interquartile range away from the quartiles (single dots). The lovastatin- and the combination-treated mice, respectively, showed significantly smaller final tumor areas than the vehicle-treated mice (P = .024 and P = .034). The 13cRA-treated mice showed significantly larger final tumor areas compared with the lovastatin-treated ones (P = .028). Moreover, the 13cRA-treated group showed larger final tumor areas compared with the combination-treated group, although the difference was not statistically significant (P = .103). There was neither significant difference in the final tumor areas between the vehicle- and the 13cRA-treated group, nor between the lovastatin- and the combination-treated group, respectively (P = .850 and P = .595, respectively). B, Median tumor areas in mm2 (tumor area: l*w) at 4 different time points from day 22 to 30 after tumor cell injection. From day 22 to 30, the combination-treated tumors showed highly significantly slower growth than the vehicle-treated ones (P = .008) and significantly slower growth than the 13cRA-treated ones (P = .036). There were nonsignificant trends for a slower growth of the lovastatin-treated tumors, compared with the vehicle-treated ones, and for a slower growth of the combination-treated tumors, compared with the lovastatin-treated ones (P = .105 and P = .059, respectively).

