
Figure 1.
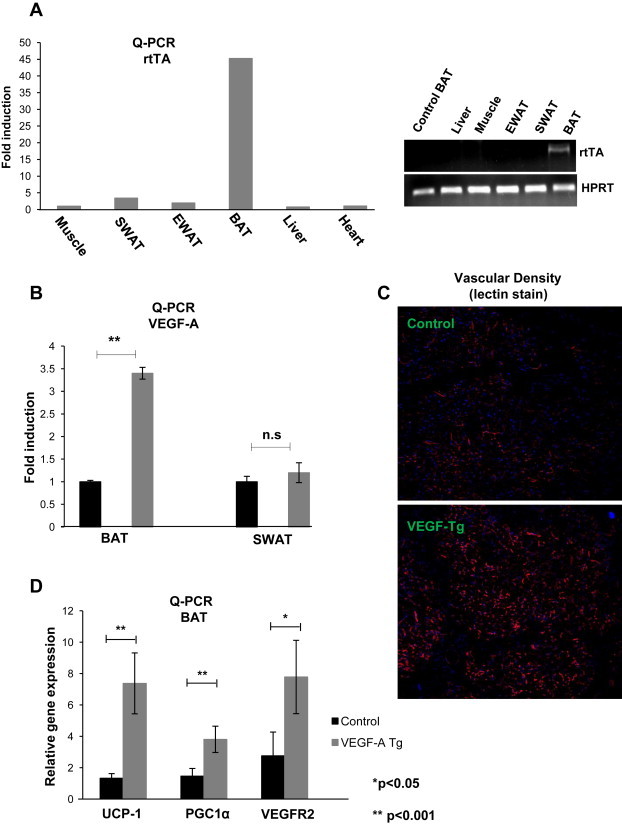
Overexpression of VEGF-A in BAT stimulates vascularization and up-regulates mitochondrial genes. (A) Left: Q-PCR analysis for tissue distribution of rtTA mRNAs in a UCP1 promoter driven rtTA overexpression model; Right: regular PCR analysis of rtTA overexpression in different fat pads and other organs in the UCP1-rtTA transgenic model. (B) Q-PCR analysis of VEGF-A overexpression in BAT and SWAT in UCP1-rtTA and TRE-VEGF-A double transgenic mouse stain (n = 4 per group, Student's t-test, **p < 0.001). (C) Representative sections of functional blood vessels in BAT labeled by tail-injected Rhodamine fluorine dye tagged lectin-1 in VEGF-A Tg and their littermate control mice. Blood vessels are shown in red, while the nuclei are in blue (DAPI staining). The images were visualized with a confocal microscope. (D) Q-PCR analysis of vascular endothelial cell marker VEGFR2 and mitochondrial functional proteins UCP1 and PGC1α in BAT of VEGF-A Tg and control mice (n = 4 in controls; n = 5 in VEGF-A Tg). The difference was analyzed by Student's t-test. *p < 0.05, **p < 0.001 vs. controls.