
Figure 1.
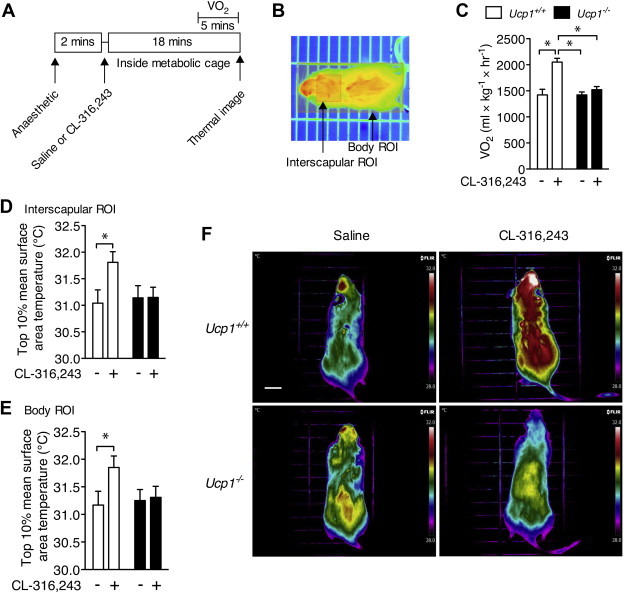
Infrared thermography specifically detects UCP1-mediated thermogenesis in vivo. (A) Time course of the indirect calorimetry and infrared thermography measurements. (B) A representative image of the region of interest (ROI) boxes overlaid on a mouse infrared image during Amide image analysis. (C) Oxygen uptake (VO2) and dorsal surface temperature within a region of interest (ROI) surrounding, (D) the interscapular BAT area, and (E) the entire body of Ucp1+/+ and Ucp1−/− mice following i.p. injection of saline or CL-316,243. N = 8–9 per group. Surface temperature is calculated as the average of the highest 10% area of the ROI. (F) Representative infrared images of Ucp1+/+ and Ucp1−/− mice following the two separate treatments. Images are displayed using the rainbow high contrast color palette in the FLiR Research IR program using a temperature linear display between 28 and 32 °C. Scale bar is 1 cm. *Indicates a significant difference (P < 0.05) from the indicated group as determined using a 2-way repeated measures ANOVA. Data are mean ± SEM.