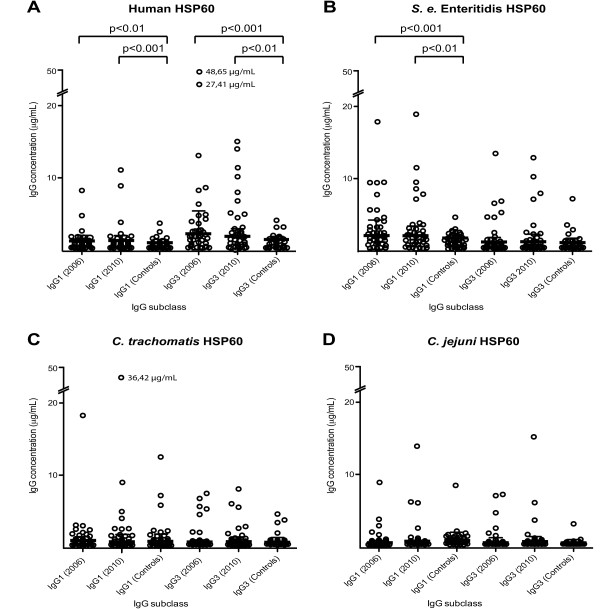
Figure 4.

Antibody levels to human and bacterial HSP60 in the SpA cohort group and the control group. Serum levels (µg/ml) of IgG1 and IgG3 antibodies against (A) human HSP60, (B) Salmonella enterica Enteritidis, (C) Chlamydia trachomatis HSP60 and (D) Campylobacter jejuni HSP60 in the SpA cohort group and the control group. The bars represent the medians with IQRs. The scale on the y-axis has been modified after 20 µg/ml to include outliers and increase resolution. Statistical analyses of differences between groups were done with the nonparametric Mann-Whitney rank-sum test. Only probabilities <0.01 were considered significant and are highlighted in the figure.
