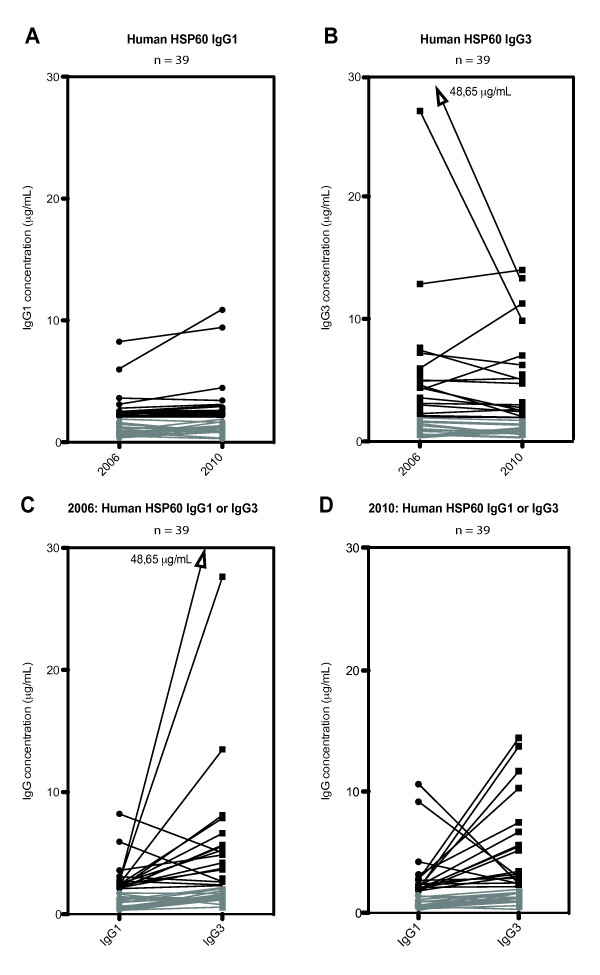
Figure 6.

Change in antibody levels against human HSP60 in sera from SpA patients. Change in serum levels (µg/ml) and subclass specificity of IgG1 (circle) and IgG3 (square) against human HSP60 (n = 39). A line links each serum value from 2006 with that of 2010. (A) Change in serum levels of IgG1 from 2006 through 2010. (B) Change in serum levels of IgG3 from 2006 through 2010. (C) Antibody level between IgG1 and IgG3 in 2006. (D) Antibody level between IgG1 and IgG3 in 2010. Serum levels below 2 μg/ml are shown in gray.
