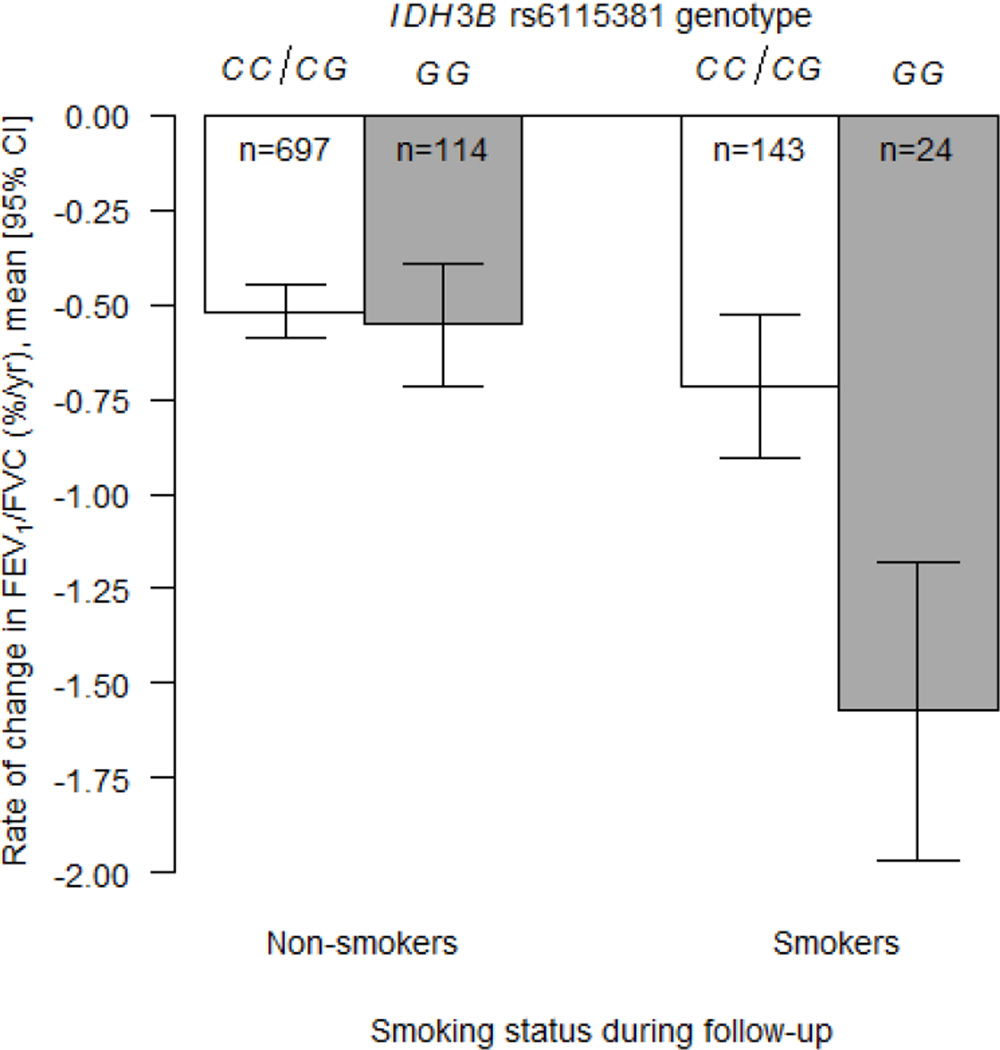
Figure 3.
Estimated rates of change in FEV1/FVC (% per year) according to smoking status during follow-up and IDH3B rs6115381 genotype for African American participants in the Health ABC study. Open bars represent the CC/CG genotypes and shaded bars represent the GG genotype. The estimates were computed from the linear mixed effects model that was adjusted for all covariates and included the SNP × smoking status × time product term (P = 4.60 × 10⁻⁴ following a recessive genetic effect model). CI = confidence interval.

