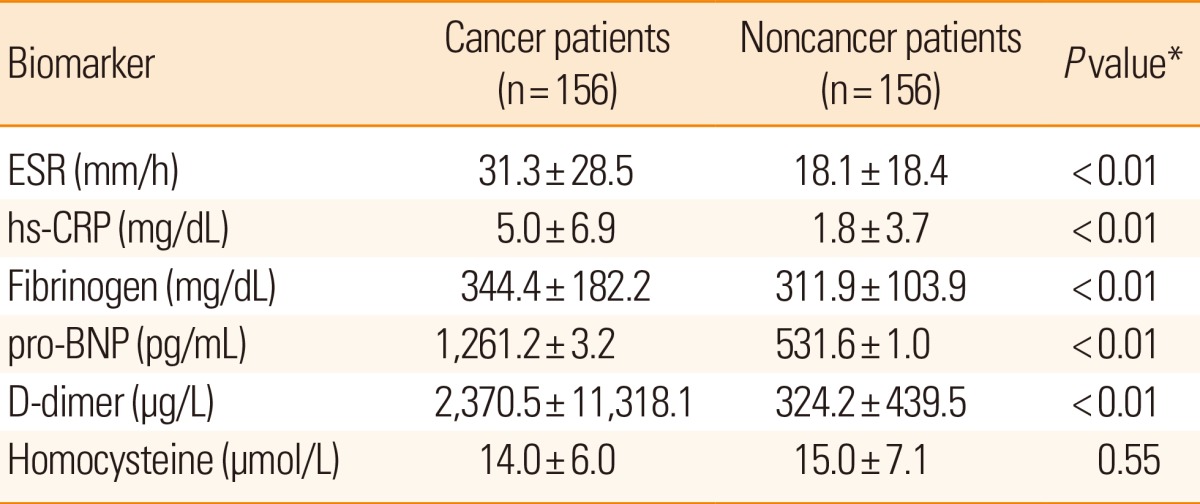
Table 3.
Stroke Biomarkers in Cancer vs Noncancer Patients with Ischemic Stroke

Values are presented as mean±SD.
*Statistics were analyzed using Student's t-test.
ESR, erythrocyte sedimentation rate; hs-CRP, high-sensitivity C-reactive protein; pro-BNP, pro-brain natriuretic peptide; SD, standard deviation.
