
Figure 6.
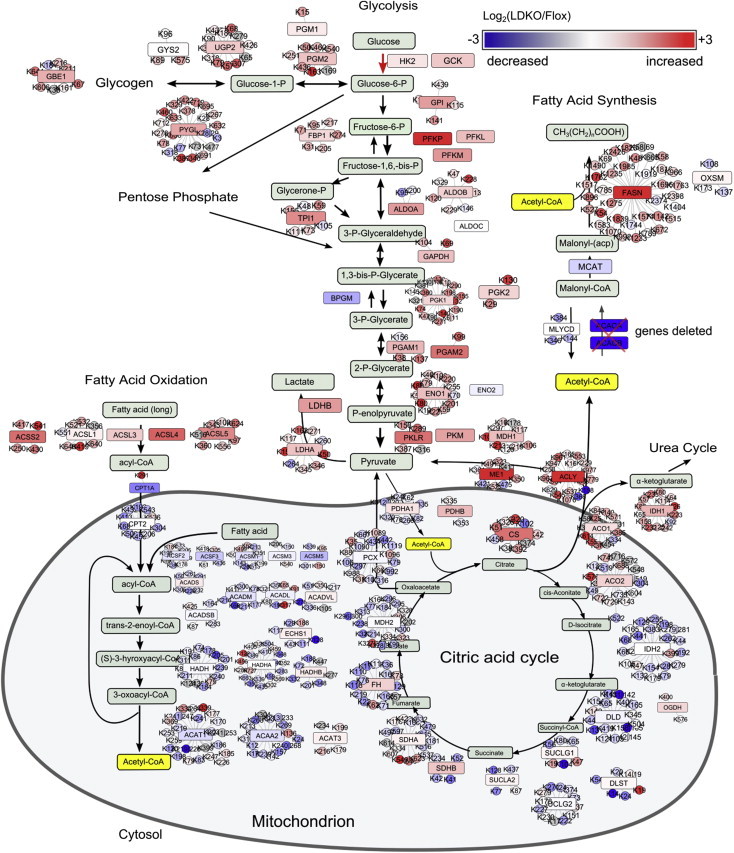
Schematic showing the protein acetylation sites in metabolic pathways that are most differentially acetylated in LDKO/flox liver. Pathway color scheme: Red, increased in LDKO vs. flox; blue, decreased; red or blue box, enzymes; circle, acetylation sites on each enzyme.