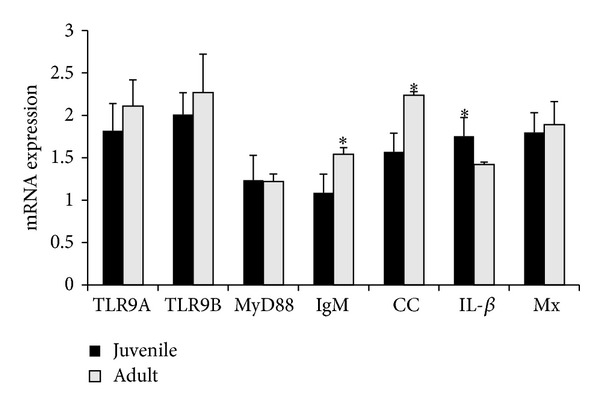
Figure 2.

Quantitative analyses of toll-like receptor 9 and immune-related gene expression in intestine of juvenile and adult. The relative expression variance is showed as ratio (the amount of gene mRNA expression normalized to the corresponding beta actin values). Data are shown as mean ± SD (n = 2). The significant difference is indicted with asterisk (∗) in the figure.
