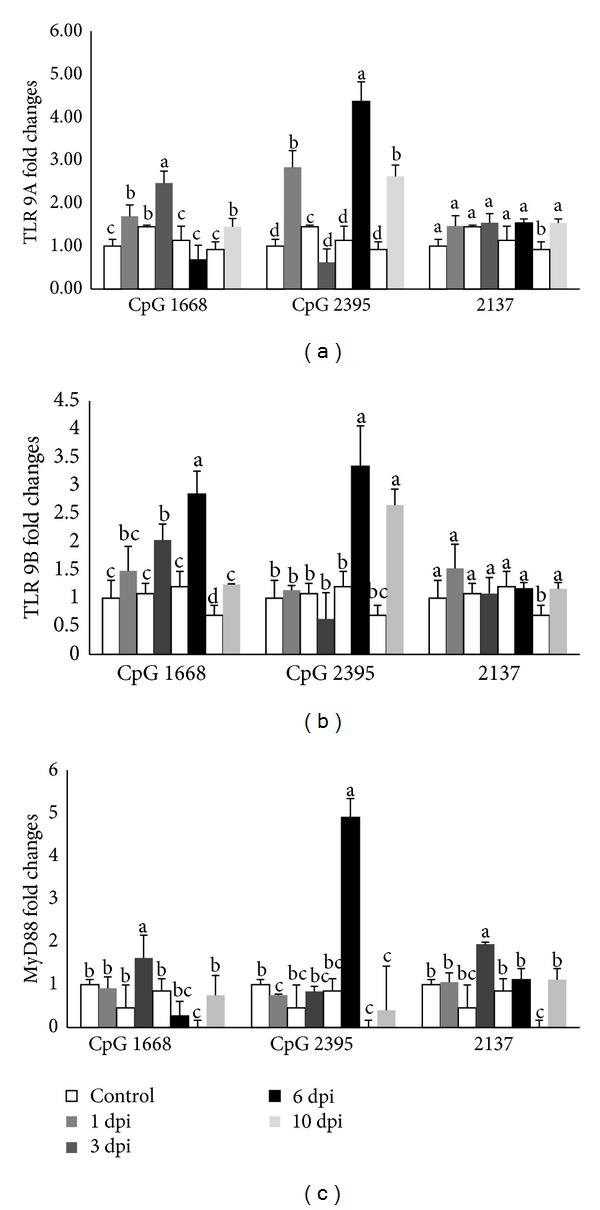
Figure 3.

The relative mRNA expressions of TLR 9A (a); TLR 9B (b); and MyD88 (c) in cobia intestine after stimulating with different CpG ODNs (1668, 2395) and ODN 2137 as control measured by quantitative real-tie PCR at 1, 3, 6, and 10 days after stimulation. The expression values represented as “fold change” were compared to the noninjected control samples and β-actin was used as a reference gene. The results are presented as the mean ± SD (n = 2) and mean values with different alphabetical letters are significantly different (P ≤ 0.05).
