Figure 1.

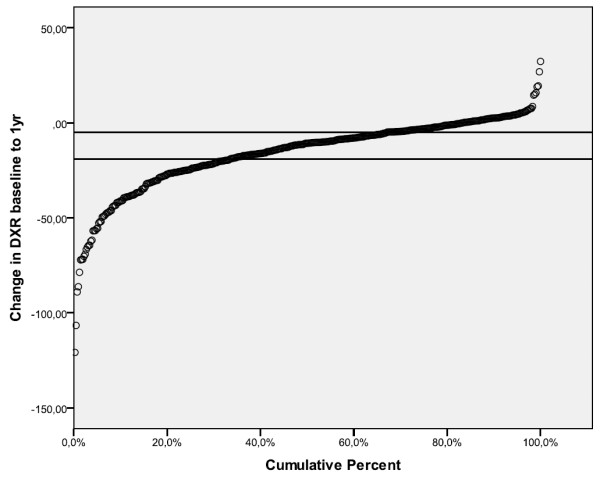
Cumulative percent plot of the change (mg/cm2) in DXR from baseline to one year. Reference lines denote tertiles -upper tertile- a change of -18 mg/cm²; lower tertile - a change of -5 mg/cm². DXR, digital X-ray radiogrammetry.

Cumulative percent plot of the change (mg/cm2) in DXR from baseline to one year. Reference lines denote tertiles -upper tertile- a change of -18 mg/cm²; lower tertile - a change of -5 mg/cm². DXR, digital X-ray radiogrammetry.