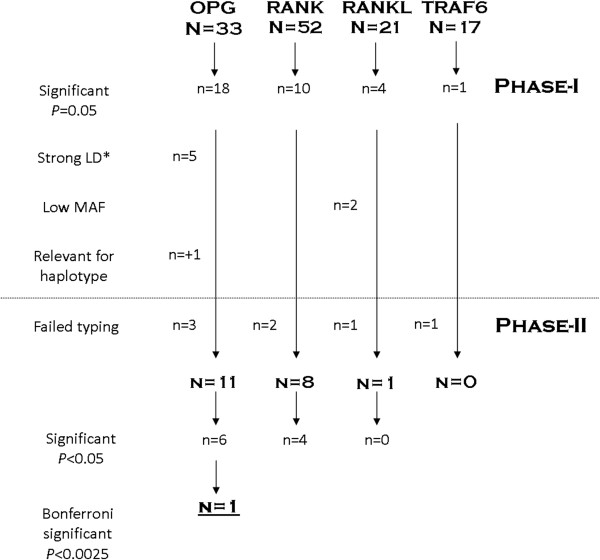
Figure 2.

Schematic depiction of the SNPs selection process. *LD is linkage disequilibrium, some SNPs were in strong correlation in the dataset of phase-1 as calculated with R2 in haploview, or were part of a haplotype were other SNPs caused the significant association.
