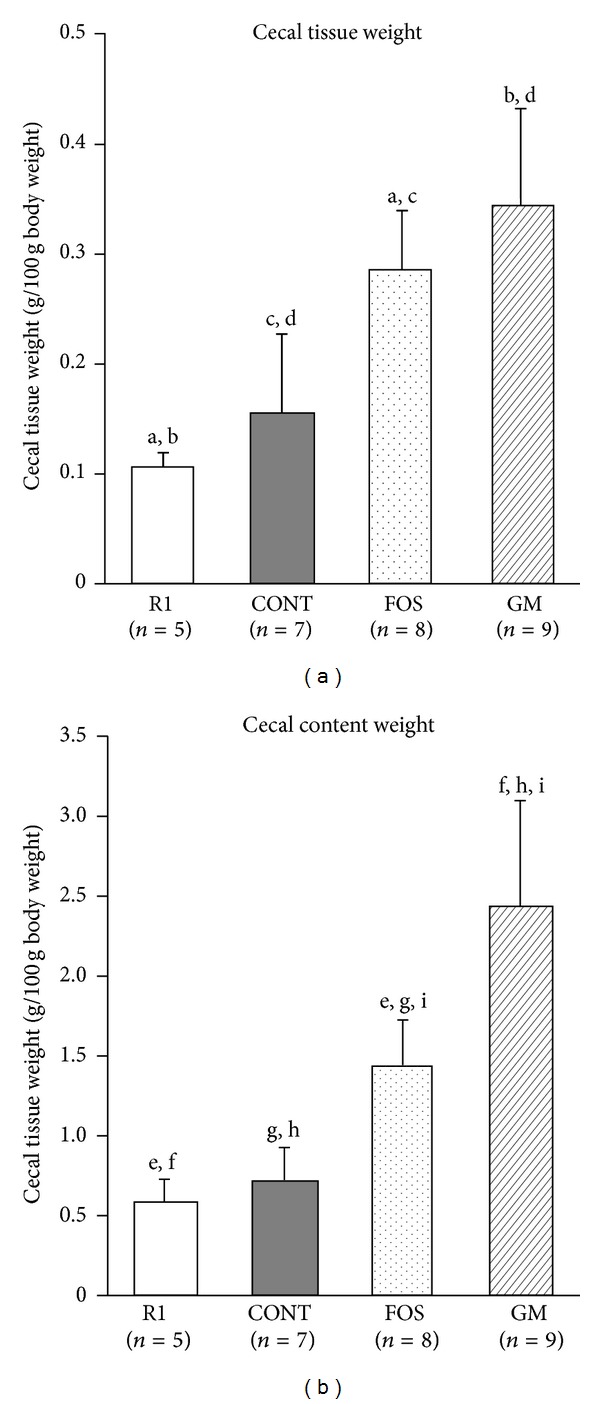
Figure 3.

Weights of cecal tissue and content in SAMP8 fed diet containing FOS or GM at 38 weeks after feeding. Values were expressed as mean ± SD. R1, SAMR1, and control diet; CONT, control diet; FOS, 5% of fructooligosaccharide diet; GM, 5% of glucomannan diet. a–i: significant differences were evaluated by ANOVA and same superscripts were significantly different by Tukey's post hoc test, at P < 0.05.
