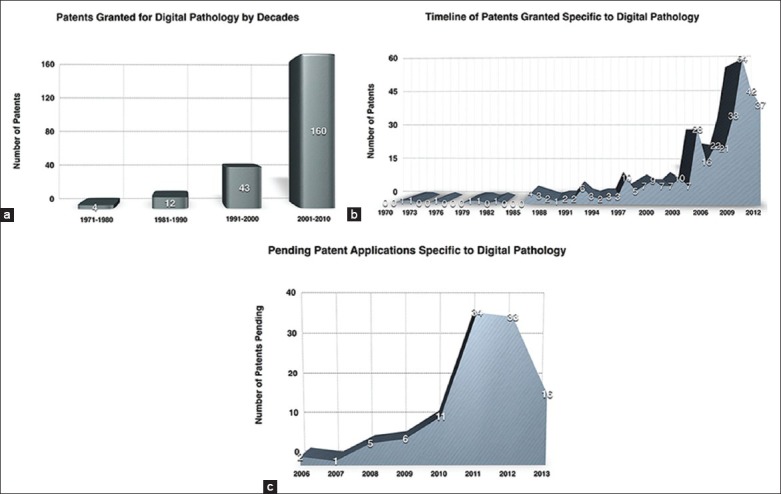
Figure 2.

(a) Graph depicting the number of patents specific to digital pathology granted between 1971 and 2010, grouped by decades. Note the marked increase in the number of patents during 2001-2010. There were 160 patents (46% of all patents) granted during 2001-2010 compared to only 43 (12% of all patents) granted during 1991-2000. (b) Timeline of patents granted, that are specific to digital pathology. The graph shows a steep increase in patents over the last decade. The dip seen on the graph in 2013 is likely an artifact of the study due to the lag between the time patents are awarded and the time they are published in the USPTO public database. (c) Graph depicting pending patents specific to digital pathology. Similarly, the dip seen on this graph in 2013 is likely an artifact due to the lag between the time patent applications are made and the time they are published in the USPTO public database
