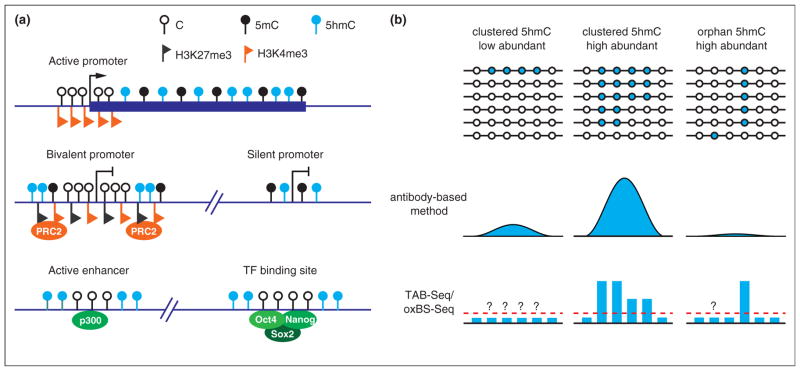
Figure 3.
Genomic distribution of 5hmC. 1. Schematic diagram illustrating the 5hmC distribution in the genome of mouse ESCs. 5hmC is preferentially enriched at gene bodies of actively transcribed genes, bivalent and silent promoters, as well as active enhancers and a cohort of pluripotency transcription factor binding sites. 2. Comparison between the antibody-based 5hmC profiling methods and the single-base resolution methods. Antibody-based methods are not sensitive enough to detect all orphan 5hmCs, and thus may not be able to detect low 5hmC-density regions. In contrast, the single-base resolution methods can quantitatively determine the levels of orphan 5hmCs. However, the single-base resolution methods still cannot achieve low detection limitation (red dashed line) with normal sequencing depth. Thus, 5hmCs with low abundance in a population of cells may not be confidently identified.

