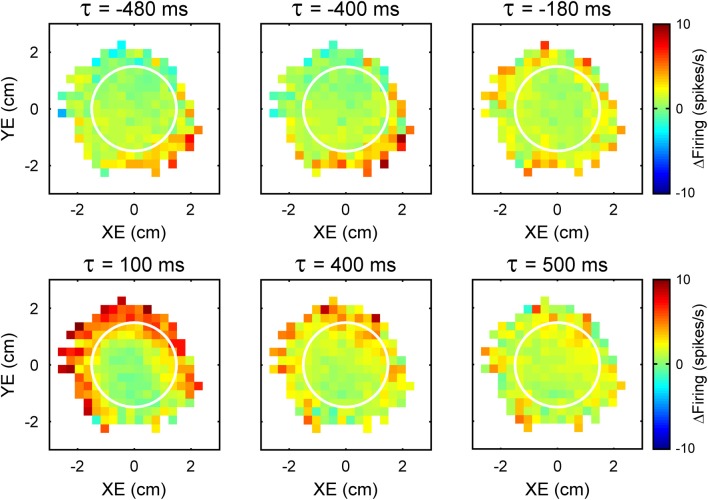
Figure 2.
Time course of the simple spike modulation with performance errors. Each plot is the simple spike firing in relation to XE and YE as a function of time (τ) from an example Purkinje cell. Negative τ represents the firing leading the error signals. As in Figure 1, simple spike firing rate is color coded relative to overall mean firing and in relation to the target (white circle).

