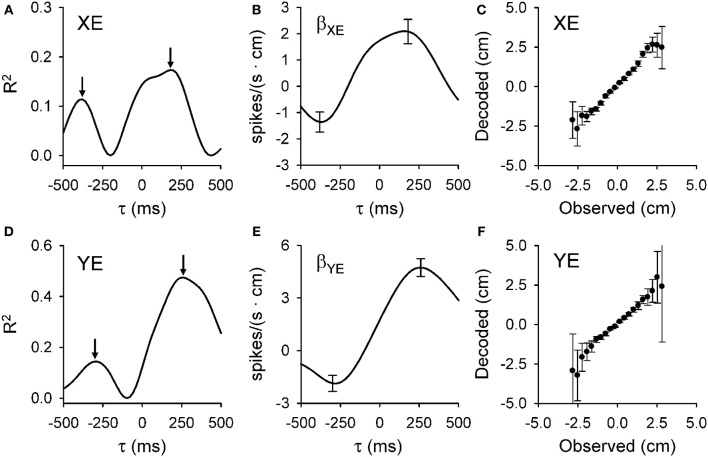
Figure 3.
Dual temporal encoding of error signals. (A,D) R2 as a function of lead/lag (τ) for position error parameters (XE and YE, respectively) from the Purkinje cell shown in Figure 1. (B,E) Regression coefficients for XE (βXE) and YE (βYE) as a function of τ. Arrows denote the times of the significant R2 peaks and error bars the confidence intervals of βXE and βYE at the times of the R2 maxima [arrows in (A,D), respectively]. Note change in the sign of regression coefficient showing the reversal in the firing sensitivity at predictive versus feedback timing. (C,F) Plot of the decoded upcoming XE and YE (mean ± SD) versus observed based on the population of Purkinje cells. Slope of decoded estimate versus the observed is 0.99 (ρ = 0.95, p < 0.001) for XE and 0.98 (ρ = 0.83, p < 0.001) for YE showing the accuracy of the prediction. Decoding estimates were from 25 repetitions of the off-line decoding algorithm (see Popa et al., 2012). Plots are reproduced from Popa et al. (2012) with permission.

