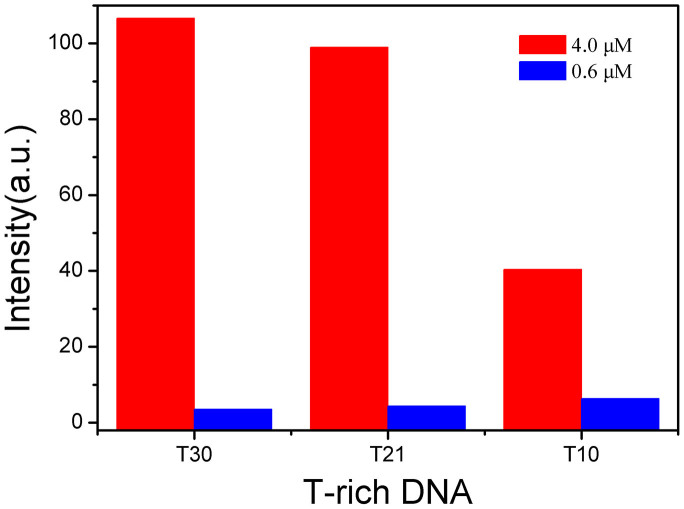
Figure 2. The fluorescence responses of different T-rich DNA at the concentrations of Hg2+ of 4.0 μM ( ) and 0.6 μM (
 ).
).
T10: T10 + Hg2+ + GO + [Ru(bpy)2(pip)]2+; T21: T21 + Hg2+ + GO + [Ru(bpy)2(pip)]2+; T30: T30 + Hg2+ + GO + [Ru(bpy)2(pip)]2+; The concentrations of T-rich DNA and [Ru(bpy)2(pip)]2+ were 3.0 μM and 2.0 μM, respectively. The concentration of GO was 5.0 μg/mL. The excitation and emission wavelengths were 455 nm and 605 nm, respectively.

