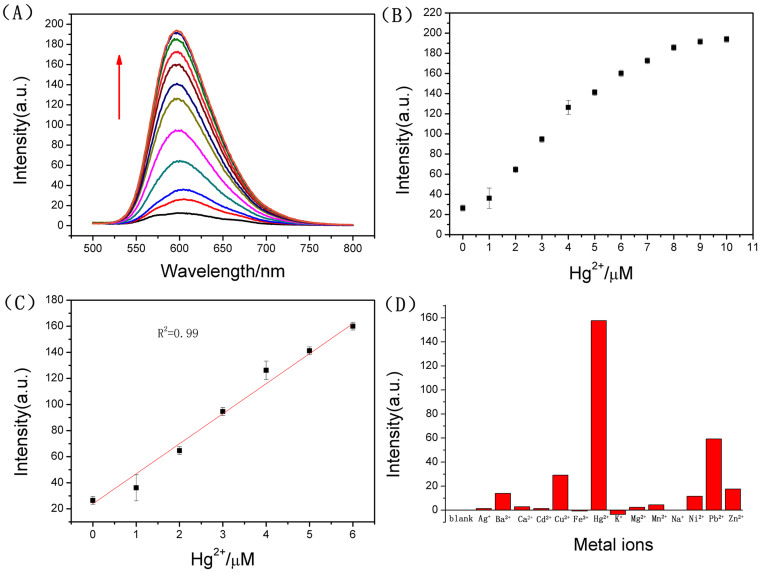
Figure 3.
(A) Fluorescence spectra of the GO-Ru-T21 system (P1) (GO = 5.0 μg/mL, Ru = 2.0 μM, T21 = 3.0 μM.) at different concentrations of Hg2+ (from bottom to top: 0, 1.0, 2.0, 3.0, 4.0, 5.0, 6.0, 7.0, 8.0, 9.0, and 10.0 μM (the bottom black line was the fluorescence spectrum of GO-Ru complex)) in 10 mM Tris-HCl buffer (pH = 7.0) at room temperature. (B) Fluorescence intensity of P1 against the concentrations of Hg2+. (C) The linear relationship of the fluorescence intensity of the P1 against the concentrations (0–6 μM) of Hg2+. (D) Selectivity of the fluorescent probe to Hg2+ against different metal ions. The concentration of Hg2+ was 6.0 μM while the other metal ions were 10.0 μM. The excitation and emission wavelengths were 455 nm and 605 nm, respectively.

