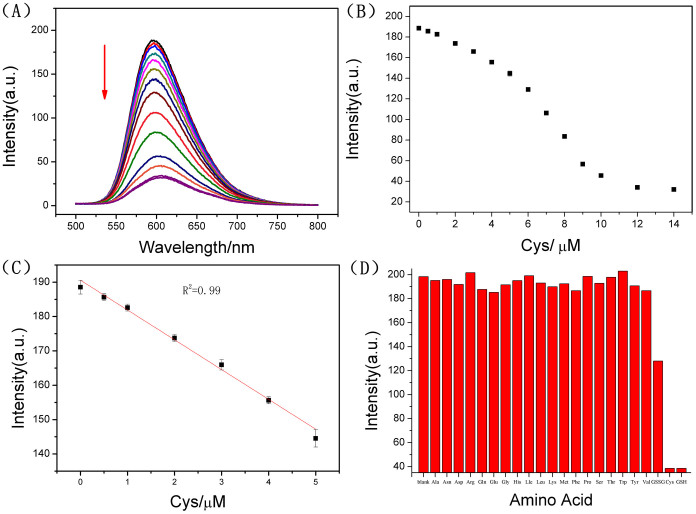
Figure 4.
(A) Fluorescence spectra of the GO-Ru-T21/Hg2+ system (P2) (GO = 5.0 μg/mL, Ru = 2.0 μM, T21 = 3.0 μM, [Hg2+] = 9.0 μM) in the presence of increasing concentrations of Cys (0, 0.5, 1.0, 2.0, 3.0, 4.0, 5.0, 6.0, 8.0, 10.0, 12.0 and 14.0 μM). (B) Fluorescence intensity of P2 against the concentrations of Cys. (C) The linear relationship of the fluorescence intensity of the P2 against the concentrations (0–5 μM) of Cys. (D) Selectivity of the fluorescent probe to Cys/GSH against different amino acids. The relative fluorescence intensity of fluorescent probe in the presence 10 μM Cys, GSH, GSSG and 100 μM other various amino acids. The excitation and emission wavelengths were 455 nm and 605 nm, respectively.

