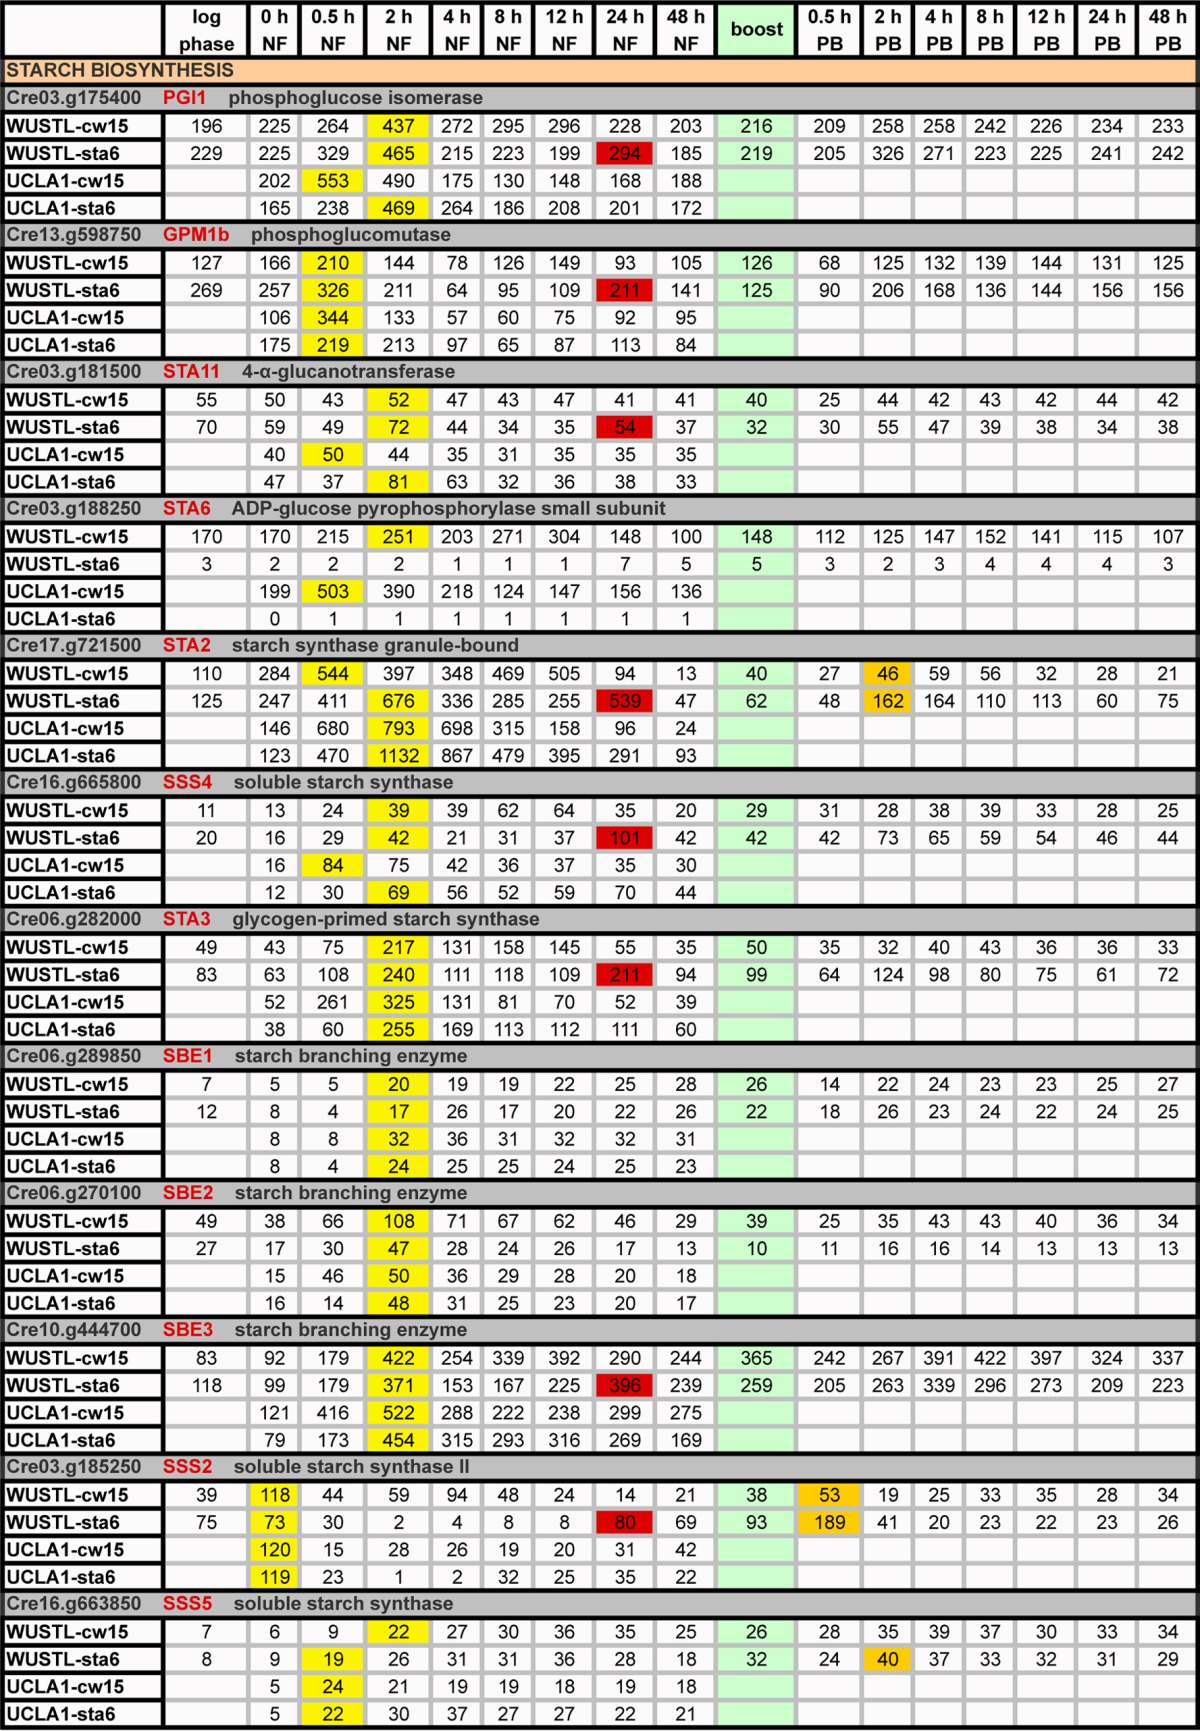
TABLE 2.
Expression profiles (RPKM) of genes participating in starch biosynthesisa

Green, boost addition; PB, postboost; yellow, time points of maximum transcripts during 0→48 h NF; orange, genes with ≥2-fold increases in expression relative to 48-h NF levels following acetate boost; red, increased gene expression in WUSTL-sta6 at 24 h NF.
