
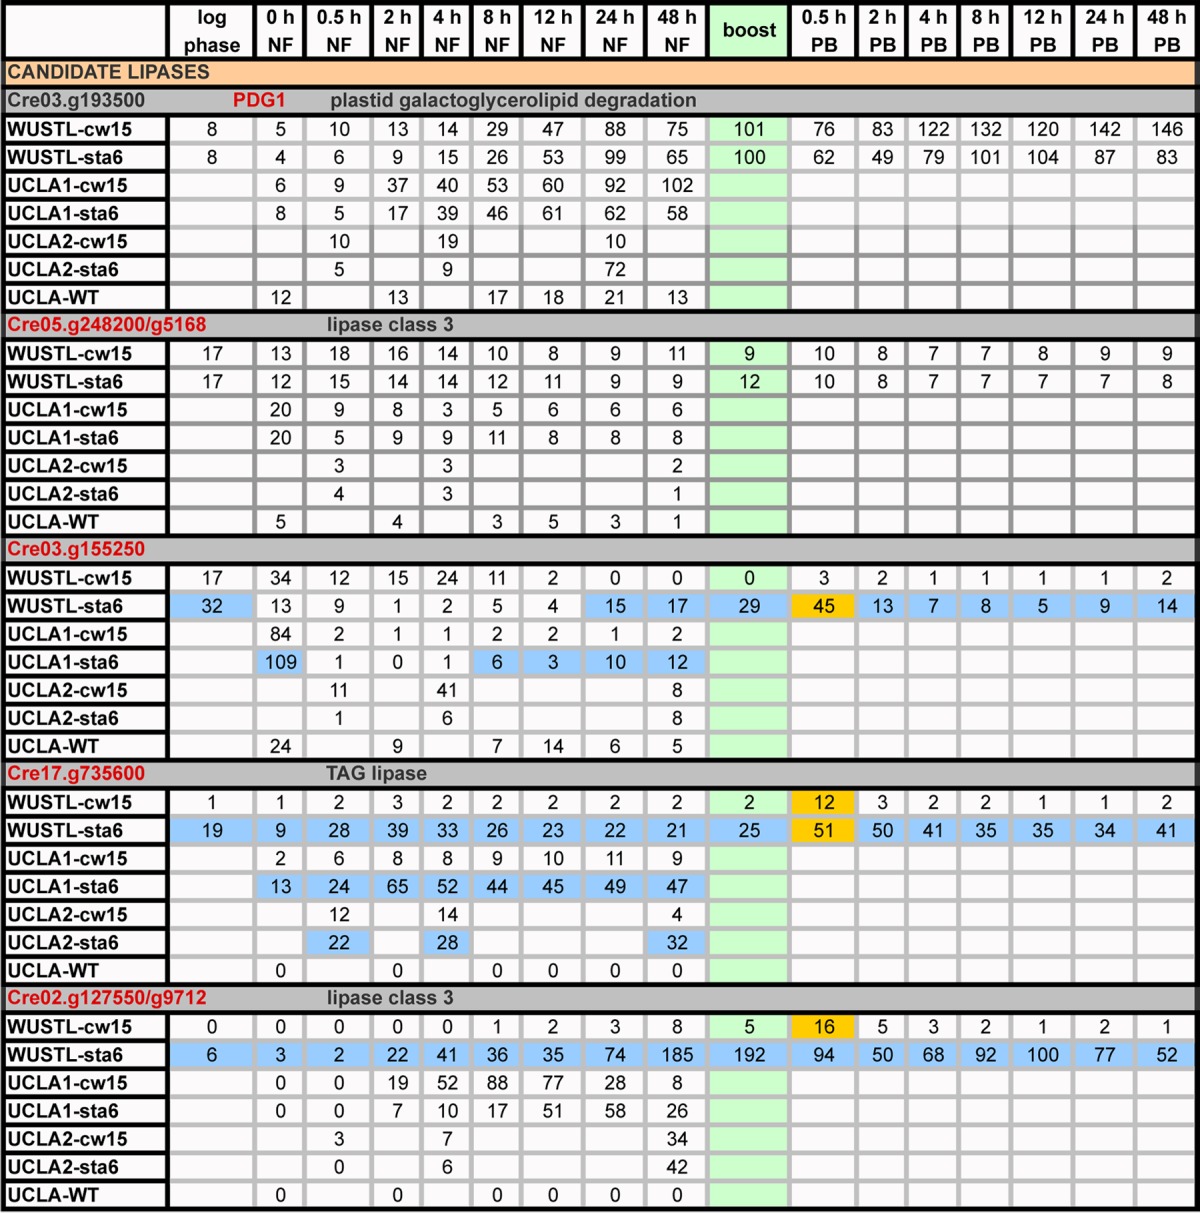
TABLE 5.
Expression profiles (RPKM) of genes encoding candidate lipasesa
a
Green, boost addition; PB, postboost; orange, genes with ≥2-fold increases in expression relative to 48-h NF levels following acetate boost; blue, genes showing strong differential expression between the sta6 and cw15 strains.