
TABLE 7.
Expression profiles (RPKM) of genes showing “sensitive” transcription patternsa
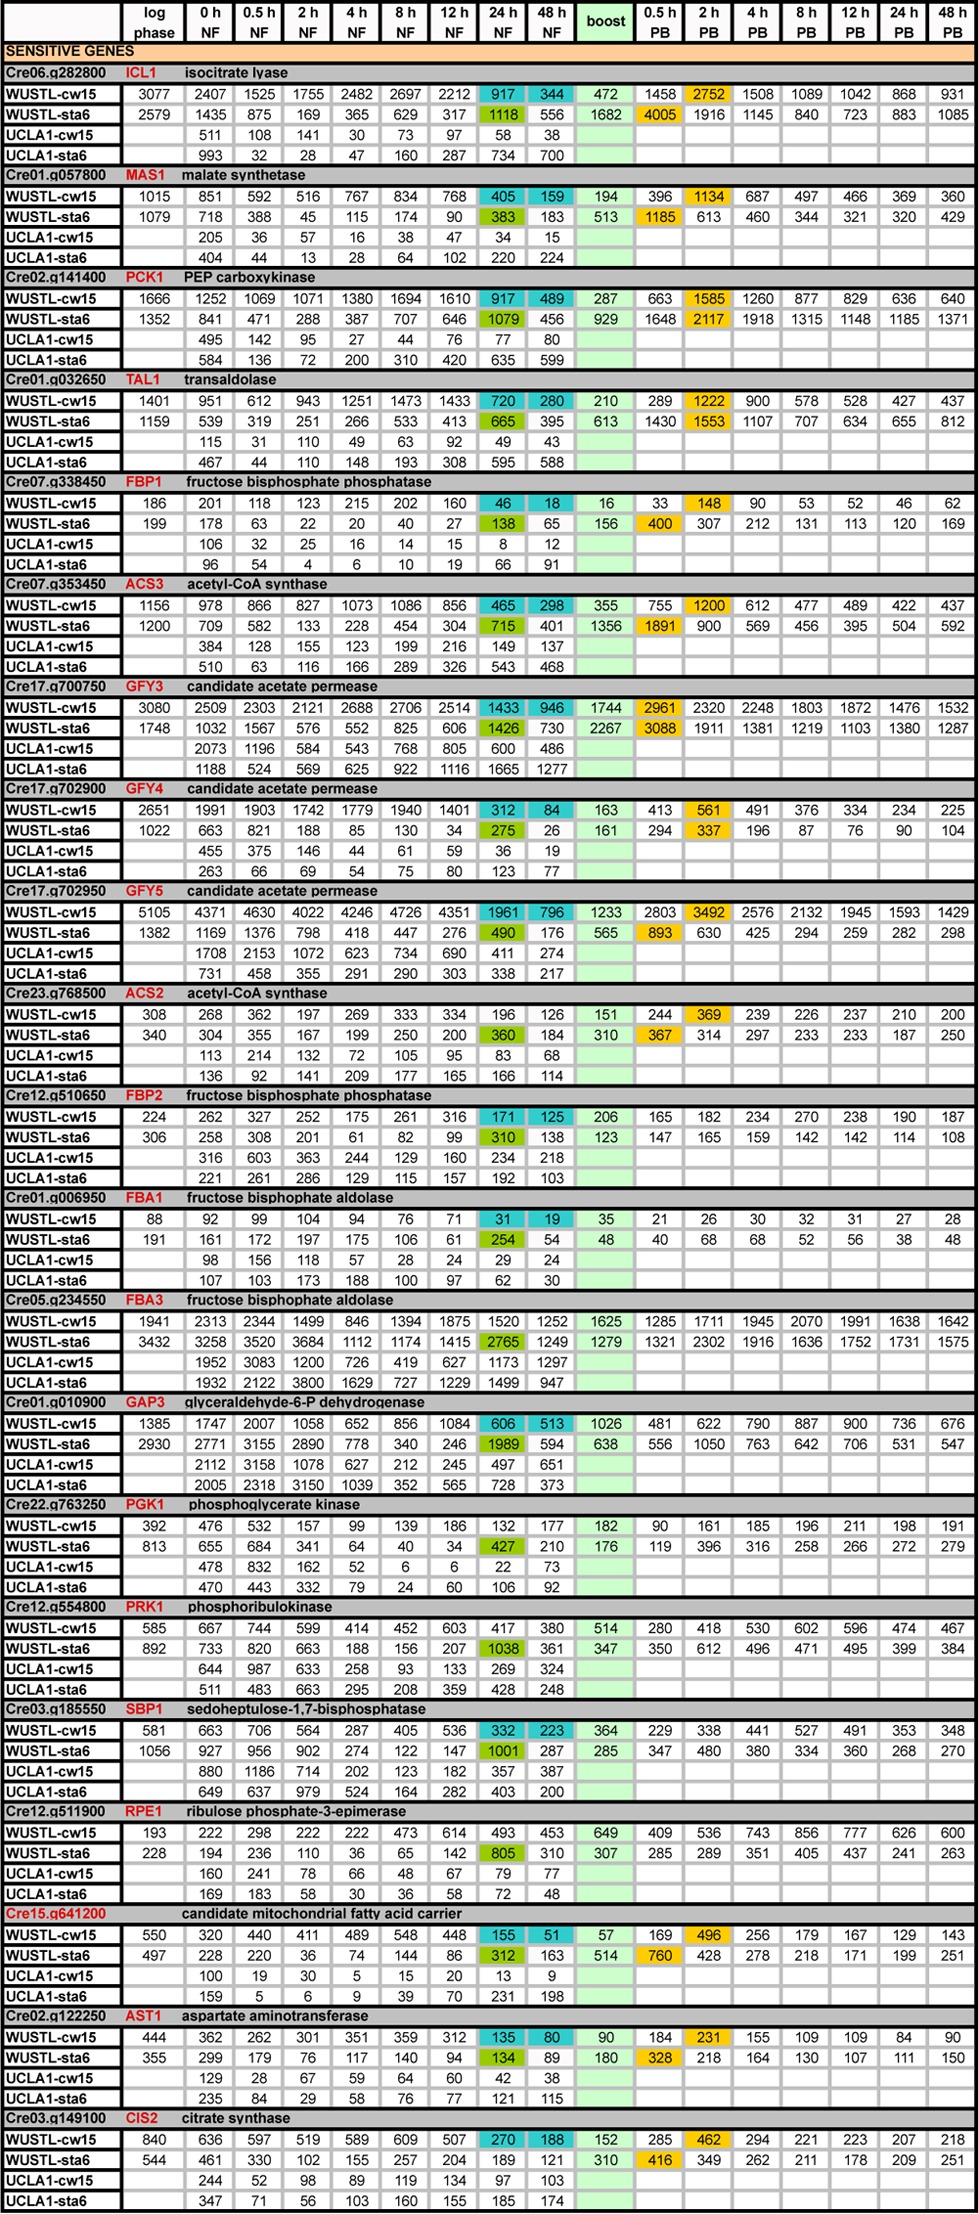
a
Light green, boost addition; PB, postboost; blue, drop in cw15 transcripts at 24 h NF and 48 h NF; dark green, increase in sta6 transcripts at 24 h NF; orange, genes with ≥2-fold increases in expression relative to 48 h NF levels following the acetate boost.