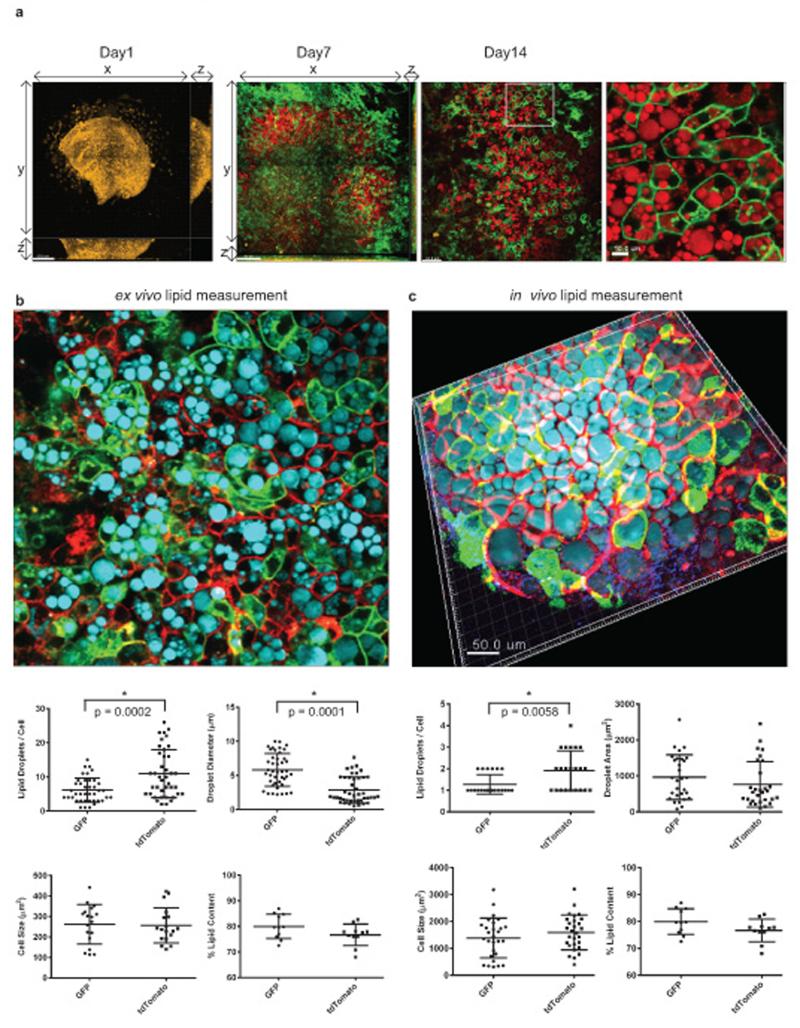
Figure 4. Characterising an ex vivo model of mesothelium/epididymal appendage differentiation into adipocytes using multiphoton microscopy.
a, Multiphoton microscope images showing epididymal appendage explants (Wt1CreERT2;mTmG/+) cultured in adipogenesis differentiation medium at Day 1, Day 7, and Day 14. Membranous GFP signal is indicated in green. CARS is used to detect lipid (indicated in red). An enlarged image of Day 14 is also included. Lipid droplet analysis of the Wt1-derived adipocytes (green) and the neighbouring adipocytes (red) from the explants culture system (b) or from epididymal fat pad induced by tamoxifen in vivo (c). (green = GFP, red = tdTomato, cyan = CARS). Analysis includes quantification of number of lipid droplets / cell, quantification of lipid droplet diameter, quantification of cell size, and quantification of % lipid content / cell. Statistics source data for (c) can be found in Supplementary Table 5.

