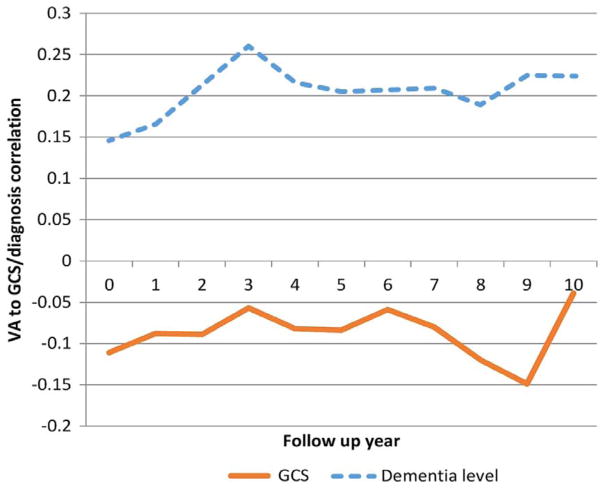
Figure 2.
Correlation between visual acuity (VA) and dementia level (global cognitive score (GCS)) over 10 years of follow-up. The GCS shows a negative correlation with VA because a higher VA score (as arbitrarily determined in this study) signifies a lower VA. This relationship is maintained during the first 7 follow-up years, as higher VA can be seen to be correlated with better (higher) GCS. Access the article online to view this figure in colour.

