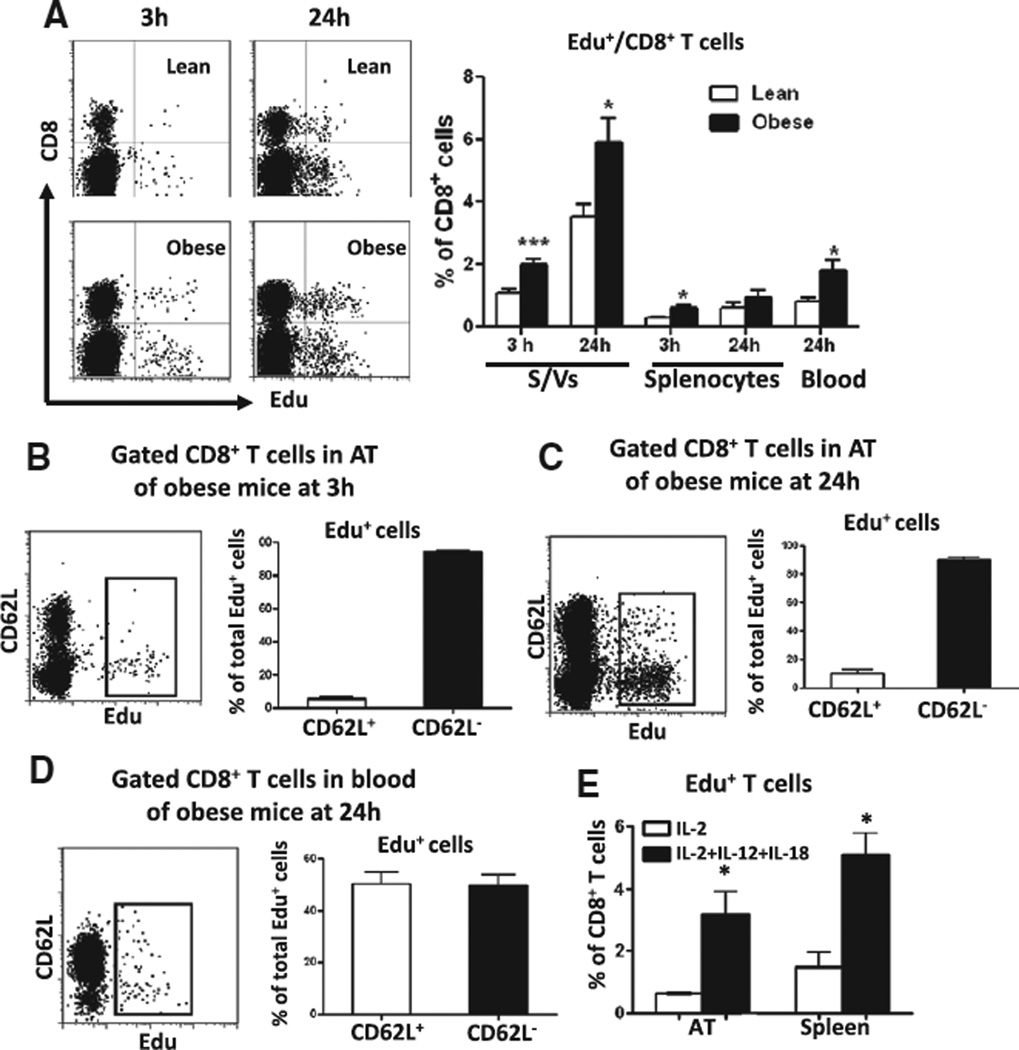
Figure 2.
T-cell proliferation in mouse adipose tissue (AT). A, Left, Representative fluorescence-activated cell sorter (FACS) dot plots showing Edu+ T cells (in gated CD3+ cells) in stromal/vascular cells (S/Vs) of lean and obese mice at 3 and 24 hours after Edu injection. Right, Quantification of the proportions of Edu+/CD8+ T cells in total CD8+ T cells in S/Vs, splenocytes, and blood (n=3–9/group). FACS analysis of CD62L on gated CD8+ T cells in S/Vs of obese mice at 3 hours (B) and 24 hours (C) after Edu injection (n=3/group). D, CD62L expression on gated CD8+ T cells in blood of obese mice at 24 hours after Edu injection (n=3/group). E, Effect of cytokine stimulation on proliferation of AT or splenic CD8+ T cells in vitro. *P≤0.05, ***P<0.001 vs lean controls or interleukin-2 (IL-2) alone.

