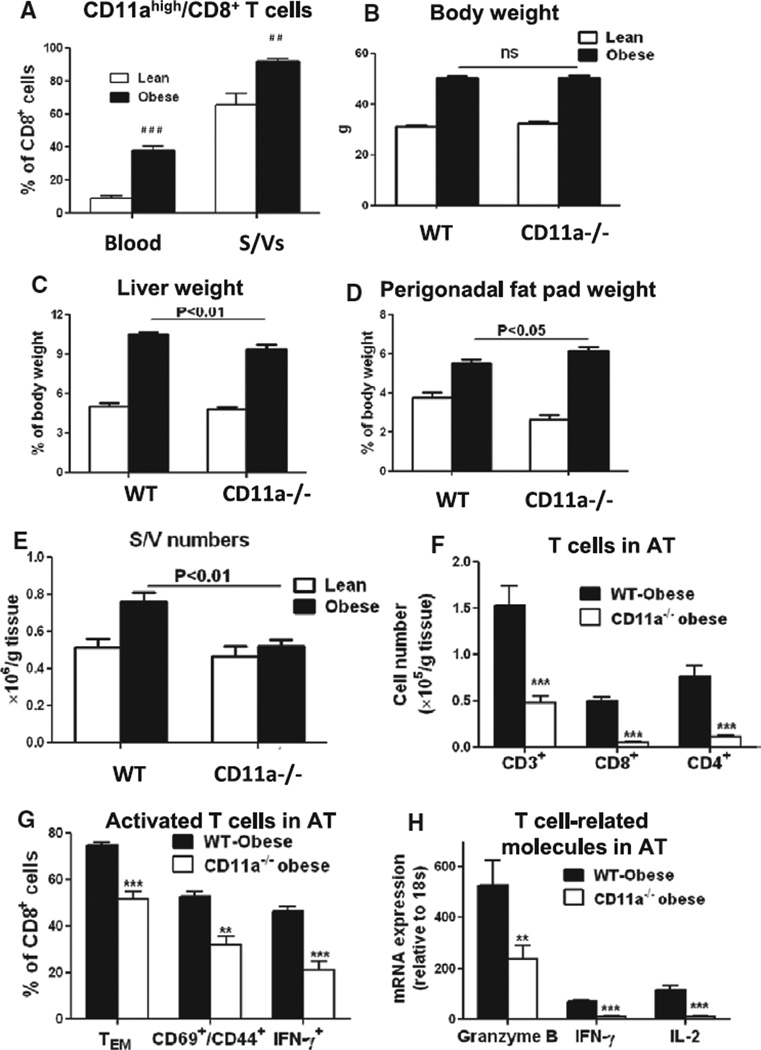
Figure 3.
CD11a and T-cell–related inflammation in adipose tissue (AT) of obese mice. A, Quantification of the proportions of CD11ahigh/CD8+ T cells in blood and stromal/vascular cells (S/Vs) of lean and obese wild-type (WT) mice (n=4–6/group). # #P<0.01, # # #P<0.001 vs lean controls. B, Body weight and ratios of (C) liver and (D) perigonadal fat pad weights to body weight of lean and obese WT and CD11a−/− mice (on chow diet or high-fat diet for 16 weeks; n=15–20 mice/group). E, Numbers of S/Vs per gram AT of lean and obese WT and CD11a−/− mice (n=15–19 mice/group). F, Numbers of total CD3+ T cells, CD8+ cells, and CD4+ T cells per gram AT of obese WT and CD11a−/− mice examined by fluorescence-activated cell sorter analysis (n=6–8 mice/group). G, Proportions of CD44+/CD62L− effector T (TE) and effector memory T (TEM) cells, CD69+/CD44+ T cells, and interferon γ (IFN-γ)–expressing T cells in CD8+ T cells in S/Vs of obese WT and CD11a−/− mice (n=5–13/group). H, mRNA levels of T-cytotoxic 1 (Tc1)/T-helper 1 (Th1)– associated genes in AT of obese WT and CD11a−/− mice measured by quantitative reverse transcriptase-polymerase chain reaction (n=6–7/group). **P<0.01, ***P<0.001 vs obese WT.

