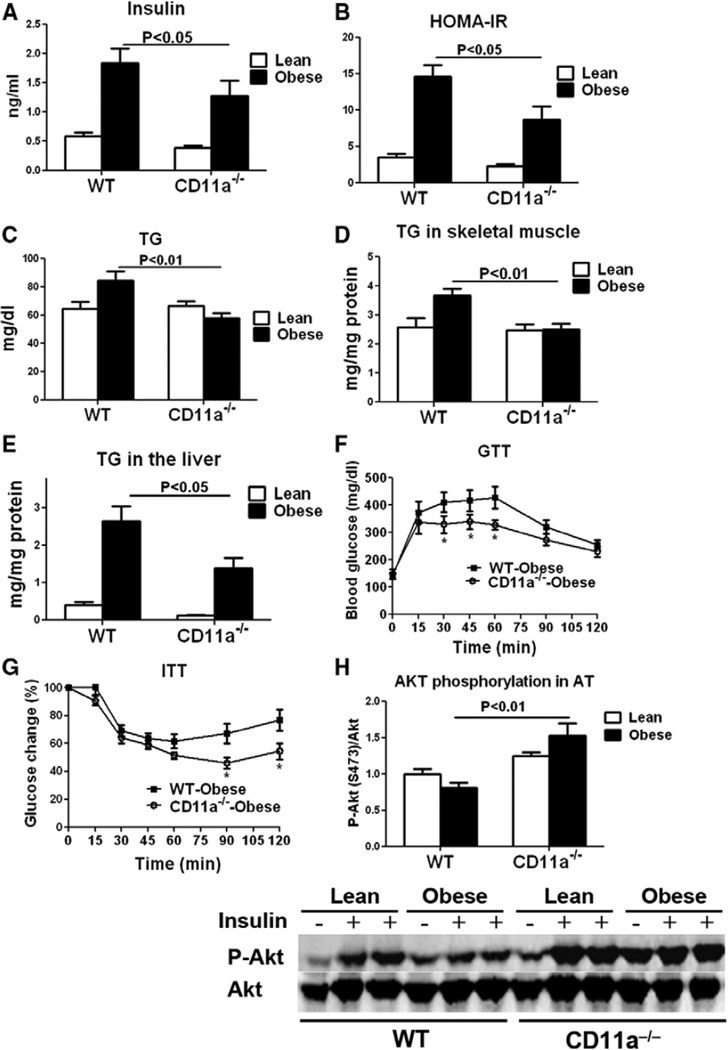
Figure 6.
CD11a−/− mice were protected against obesity-induced metabolic dysfunctions. A, Fasting plasma insulin levels, (B) calculated homeostasis model assessment of insulin resistance (HOMAIR), and (C) fasting plasma triglyceride (TG) levels of lean and obese wild-type (WT) and CD11a−/− mice (n=8/group). TG content in (D) skeletal muscle and (E) liver of WT and CD11a−/− mice (n=6–8/group). Intraperitoneal (F) glucose and (G) insulin tolerance tests in WT and CD11a−/− mice (n=7/group). *P<0.05 vs obese WT. H, Insulin-stimulated Ser473 phosphorylation of Akt in adipose tissue of lean and obese WT and CD11a−/− mice determined by Western blot (n=4 mice/group)

