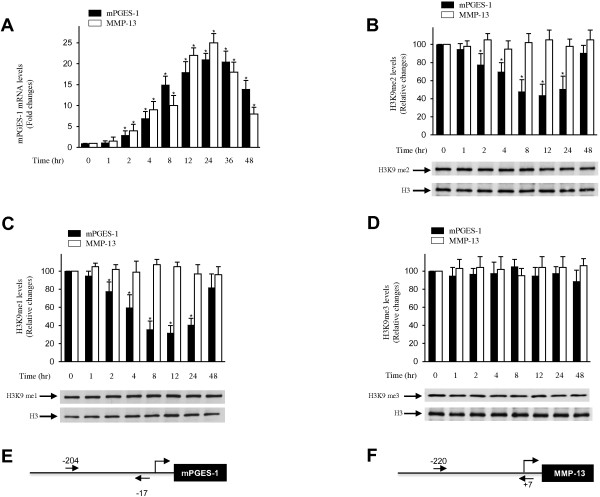
Figure 1.

Effect of interleukin 1β on histone H3 lysine 9 methylation at the microsomal prostaglandin E synthase 1 promoter. (A) Osteoarthritis (OA) chondrocytes were treated with 100 pg/ml interleukin 1β (IL-1β) for the indicated time periods. Total RNA was isolated, reverse-transcribed into cDNA, and microsomal prostaglandin E synthase 1 (mPGES-1), matrix metalloproteinase 13 (MMP-13) and glyceraldehyde 3-phosphate dehydrogenase mRNAs were quantified using real-time PCR. All experiments were performed in triplicate, and negative controls without template RNA were included in each experiment. The results are expressed as fold changes, assuming 1 as the value of untreated cells, and represent the mean ± SD of four independent experiments using cells from four different OA donors. *P < 0.05 compared with unstimulated cells. (B)- through (D) Confluent OA chondrocytes were treated with 100 pg/ml IL-1β for the indicated time periods. Chromatin immunoprecipitation (ChIP) assays, coupled with real-time PCR, were performed using antibodies specific to mono- (B), di- (C) and trimethylated (D) histone H3 lysine 9 (H3K9). me1, Monomethylation; me2, Dimethylation; me3, Trimethylation. The results are expressed as percentages of control values (that is, untreated cells) and are represent the mean ± SD of four independent experiments. For each ChIP assay, the immunoprecipitated DNA was quantitated in triplicate on two separate occasions. *P < 0.05 compared with unstimulated cells. The lower panels show chondrocytes that were treated as indicated. The levels of mono-, di- and trimethylated H3K9 and unmodified H3 were evaluated by immunoblotting. The blots are representative of similar results obtained in four independent experiments in which we used cells from four different OA donors. (E) and (F) Schematic diagrams of the mPGES-1 and MMP-13 promoters showing the locations of the PCR primers (arrows) used in the ChIP analyses.
