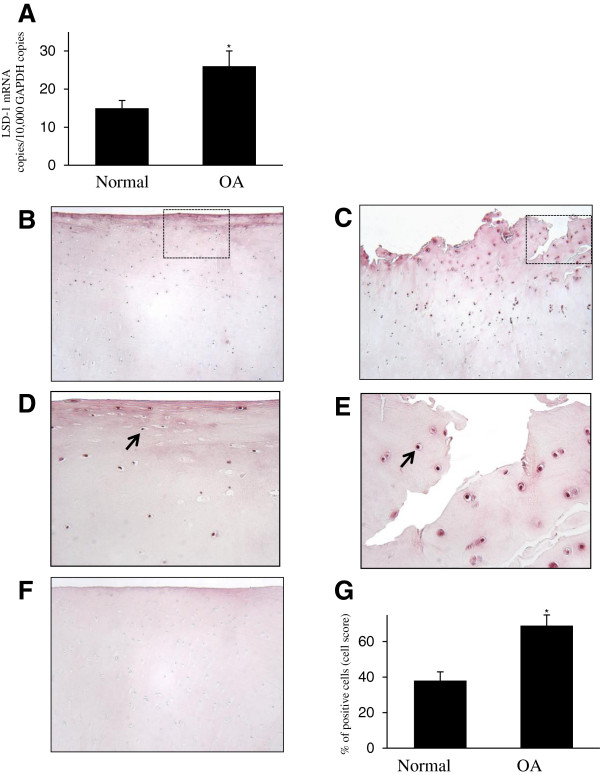
Figure 7.

Expression of lysine-specific demethylase 1 protein in human normal and osteoarthritis cartilage. (A) RNA was extracted from normal cartilage (n = 10) and osteoarthritis (OA) cartilage (n = 10), reverse-transcribed into cDNA and processed for real-time PCR. The threshold cycle values were converted to the number of molecules. The data are expressed as copies of the gene’s mRNA detected per 10,000 glyceraldehyde 3-phosphate dehydrogenase (GAPDH) copies. *P < 0.05 versus normal samples. Representative immunostained images of human normal cartilage (B) and OA cartilage (C) for lysine-specific demethylase 1 (LSD1) protein are shown. (D) and (E) Higher-magnification views of the areas within the rectangles in (B) and (C), respectively. The arrow shows postitive expression of LSD1. (F) Cartilage specimens treated with the anti-LSD1 antibody that was preadsorbed with a 20-fold molar excess of the protein fragment corresponding to amino acids 834 to 852 of human LSD1 protein (control for staining specificity). (G) Percentage of chondrocytes expressing LSD1 in normal and OA cartilage. The data are the mean ± SD of 10 normal and 10 OA specimens. *P < 0.05 versus normal cartilage.
