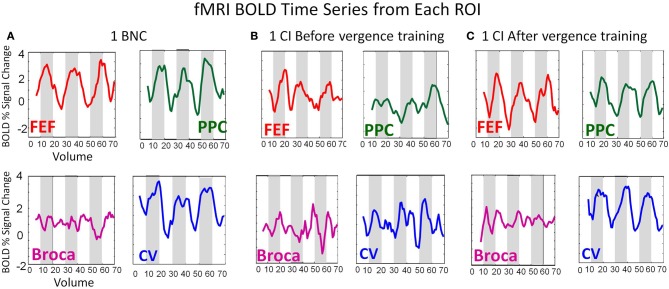
Figure 4.
BOLD time series from the FEF (red), PPC (green), Broca's Region (Purple), and CV (blue) from a BNC (A), one CI before vergence training (B), and the same CI after vergence training (C). The BOLD signal is plotted as the percent signal change as a function of volume. The time of repetition was 2 s. Hence, the time series lasts for a duration of 140 s.

