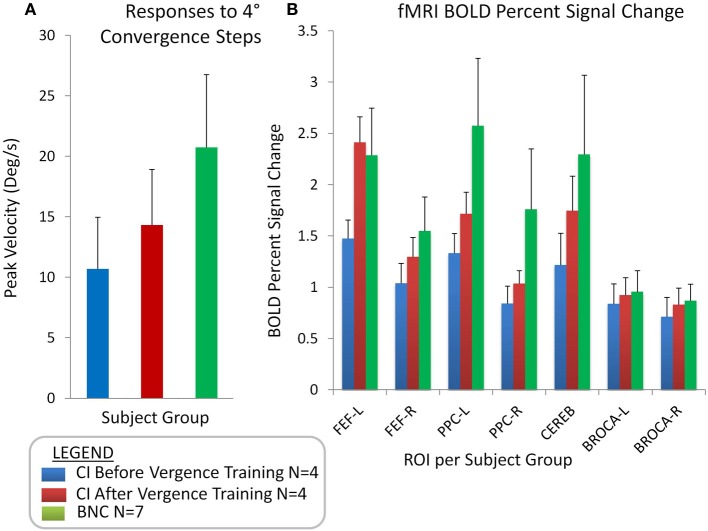
Figure 5.
Group-level analyses showing the average with one standard deviation of convergence peak velocities (°/s) evoked from 4° symmetrical convergence step stimuli (A) for CI subjects before vergence training (blue bar), CI subjects after vergence training (red bar), and BNC subjects (green bar). Group-level averages with one standard deviation for the BOLD percent signal change for the FEF-L, FEF-R, PPC-L, PPC-R, Cerebellar vermis, Broca-L, and Broca-R (B).

