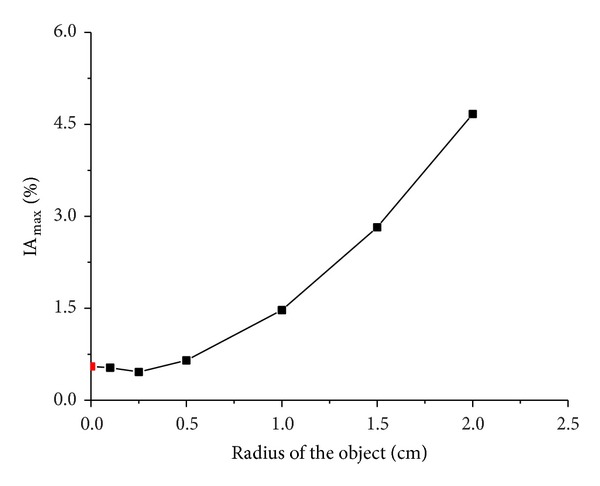
Figure 16.

IAmax of EIT data from the two hemispheres of the model with and without an ischemic lesion. Black points represent IAmax with a simulated ischemic stroke lesion, while the red point represents IAmax without a simulated lesion.

IAmax of EIT data from the two hemispheres of the model with and without an ischemic lesion. Black points represent IAmax with a simulated ischemic stroke lesion, while the red point represents IAmax without a simulated lesion.