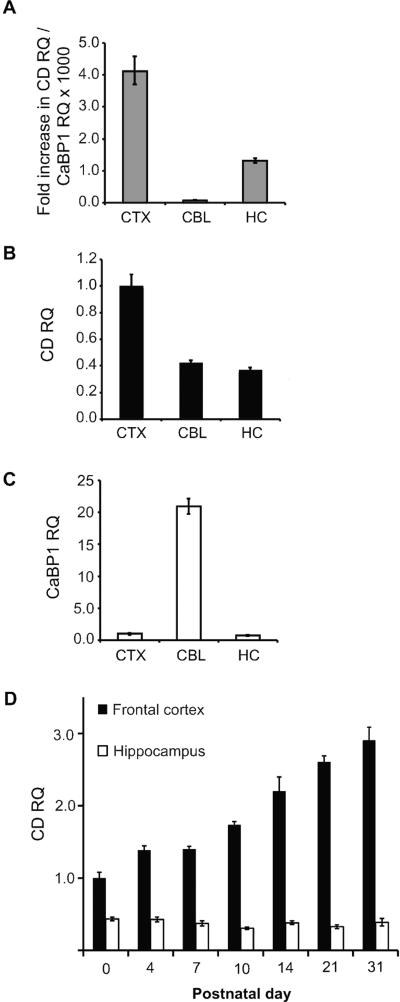
Figure 3. Quantitative PCR analysis of CaBP1 and caldendrin in the adult and developing mouse brain.
(A-C) Quantitative reverse-transcription PCR showing relative quantities (RQ) of caldendrin (CD) and calcium binding protein (CaBP1) RNA in brain regions isolated from 1-month-old mice. (A) Relative quantity (RQ) of caldendrin RNA expressed relative to CaBP1 RNA in the same region, indicating fold increase in caldendrin compared to CaBP1 RNA. (B,C) Quantities of caldendrin RNA (B) and CaBP1 RNA (C), expressed in cerebellum (CBL) and hippocampus (HC) relative to levels in the cerebral cortex. (D) Relative quantities of caldendrin in the frontal cortex (black bars) and hippocampus (white bars) at the indicated postnatal days, expressed relative to levels at birth (P0). N = 3-4 animals, data averaged from 3 separate PCR experiments with 3 technical replicates per sample per experiment (A-C) or 3-5 animals per age, data averaged from 3 technical replicates per sample (D). Error bars represent minimum and maximum possible RQ values calculated based on a 95% confidence interval of ΔCT values.

