
Fig. 2. Classification and regression tree (CART) for predicting the outcome of week 24 virological response (VR) in 93 subjects who had immune response data for baseline and week 24 time points.
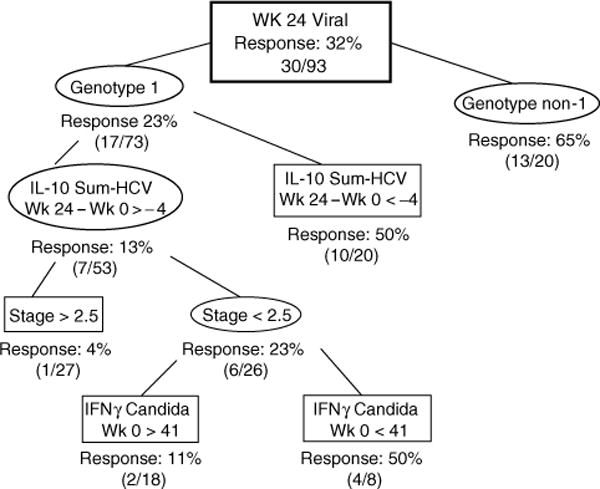
CART identified useful predictors for subgroups with higher or lower frequencies of week 24 VR. IL-10 Sum-HCV = sum of interleukin (IL)-10 responses to hepatitis C virus (HCV) proteins core, NS3 and NS5. Numbers associated with immune response data represent spot-forming cells (SFC)/106 peripheral blood mononuclear cells. IFN, interferon alfa-2a.