
Fig. 1.
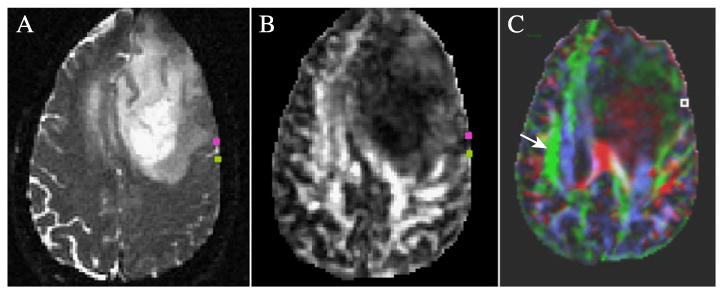
Fiber tracking starting regions for speech arrest (green) and anomia (pink) sites overlaid on (A) T2 image and (B) relative anisotropy map. (C) Illustration of the reduced anisotropy in the arcuate fasciculus and other white matter regions due to the left frontal lesion. The colors indicate the direction of the principal eigenvector (green: anterior–posterior; red: right–left; and blue: inferior–superior) and the intensity denotes the relative anisotropy. The contralateral arcuate fasciculus is indicated by the arrow. The square shows the anomia site in Broca's area that may have connections to Wernicke's area via the arcuate fasciculus but for which no pathways could be tracked.