
Fig. 5.
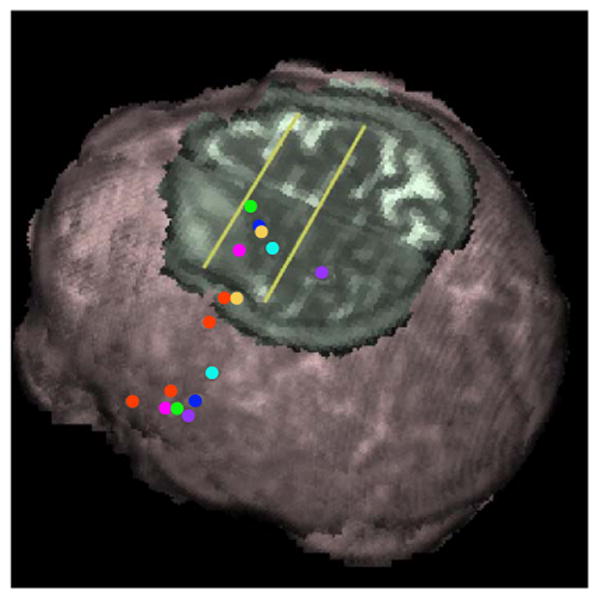
Projections of destinations of fiber tracks in the SMA and frontal gyri from stimulation sites onto an axial view of the T2 image normalized to the MNI template and at z position 68 mm. The yellow lines indicate anterior– posterior positions of the VCA (y = 0 mm) and VCP planes (y = − 22 mm), which nominally defines the SMA proper. Points on the brain surface are stimulation points and points on the axial cutout are fiber track destinations with the exception of the yellow anomia site for which the most lateral dot indicates the stimulation site. 3Mouth: purple; 2Jaw/Mouth: light blue; 41Anomia: yellow; 4Mouth: blue; 10Speech: green; 26Anomia: pink; 21Anomia: red (no superior connections); 42Anomia: red.