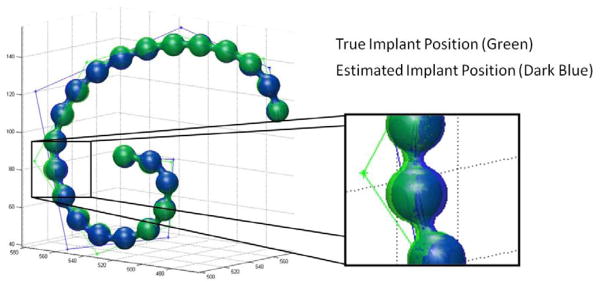
Figure 6.

Illustration of the true and estimated cochlear implant positions. Surface renderings of the true and estimated implants are largely overlapping. A zoomed in version of the rendering shows a region of the implant where the position estimation error is largest; however, even in this region, the error is subvoxel (with a maximum error of about 50 μm) and much smaller than the diameter of the electrodes. One can also see the two sets of control points for the b-splines of the true and estimated implants. While mismatched in number of control points, the overall trajectory of the two splines are very close to each other.
