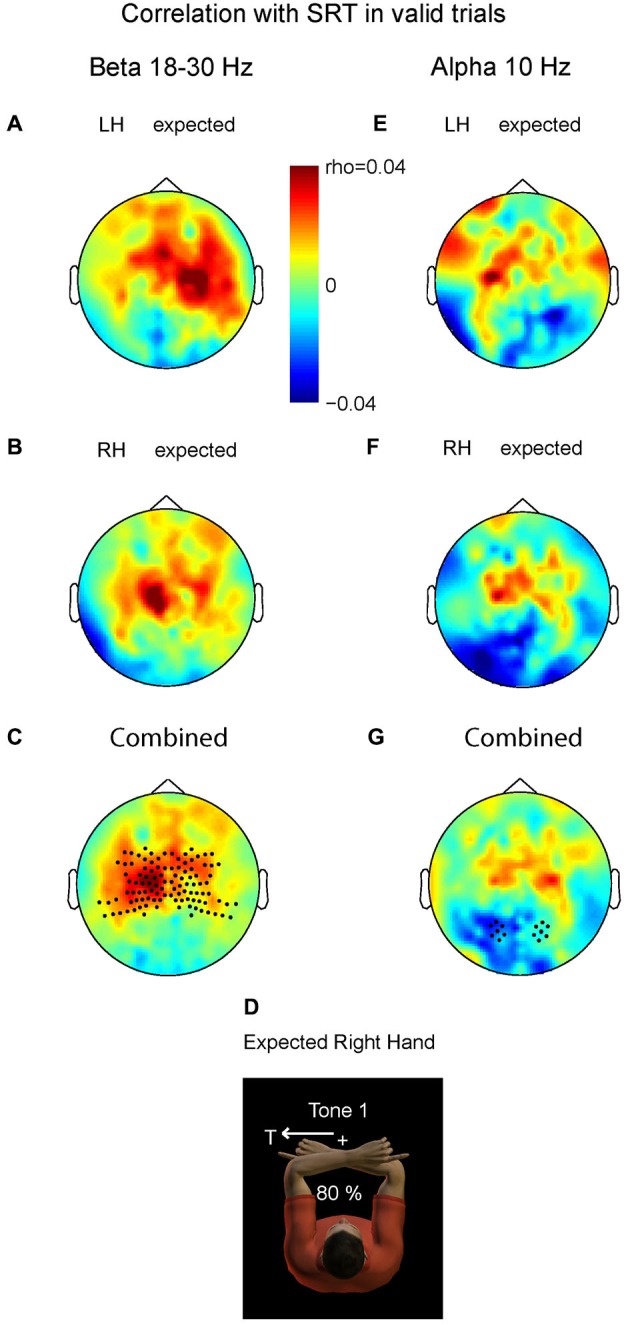
Figure 4.

Relationship between prestimulus power (beta and alpha band) and saccadic reaction time (SRT). Plotted are correlation values based on correct saccades in the valid trials. (A) Prestimulus beta. Left hand stimuli. (B) Prestimulus beta. Right hand stimuli. (C) Combined data. Correlation values differ significantly at central sensors between contralateral and ipsilateral hemispheres, mainly caused by positive correlation values contralateral, i.e., lower beta power for shorter SRTs. Correlation values do not differ at posterior sensors. (D) Depiction of expected stimulation corresponding to the format in C and G. (E–G) Prestimulus alpha; same format as in panel A–C. The more alpha ipsilateral to the saccade, the shorter its SRT. Correlation values do not differ at central sensors.
