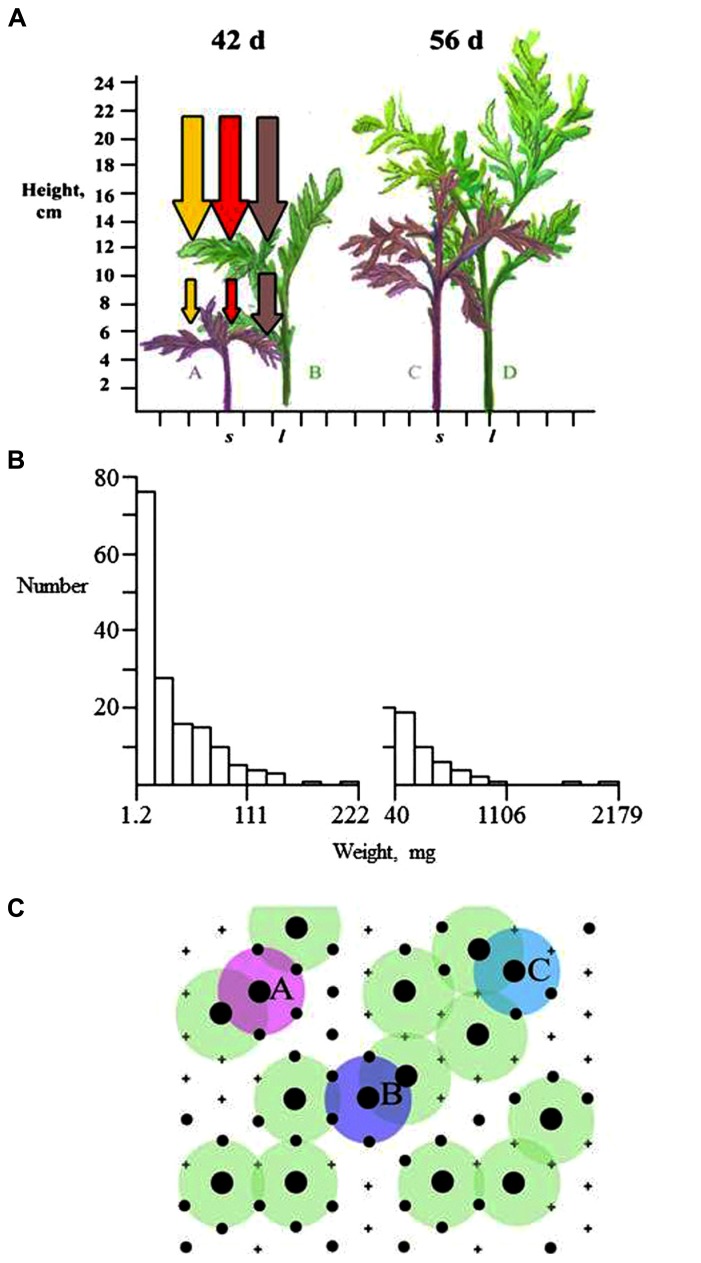
FIGURE 1.
Development of population and stand structure in T. patula planted in a 2 cm triangular lattice (after Turley and Ford, 2011). (A) Plant height after 42 and 56 days showing large (C, D) and small (A, C) plants aligned on a 2 cm scale with diagrammatic reductions in PAR, and red and far-red light. New foliage grows upwards and away from the stem so that competitive interaction takes place in three dimensions. (B) Frequency histograms of plant dry weight at 42 and 56 days illustrating reduction in total number from 400 plants and right-skewed distributions. (C) The spatial arrangement of large and small plants, represented by black circles of their respective sizes at the lattice points and dead plants indicated by +. Plants A, B, and C are each one of a pair of large plants that are within 2 cm of each other, whereas other large plants are further than 2 cm from a large neighbor.

